TradePro's Trading Idea Cipher Divergence EMA Pb StrategyHere I present you on of Trade Pro's Trading Idea: Cipher B+ Divergence EMA Pullback Strategy.
Optimized the crypto pairBTC/USDT in the 30 minute chart.
There is the possibility to switch between short and long positions.
You can choose between 2 different take profit/stop loss types: The Lowest Low/ Highest High Stop Loss/ Take Profit and the ATR Take Profit/ Stop Loss.
-----------------------------------------------------------------------------------
How does the strategy work?
ENTRY
Long
The price must be above the 200 EMA .
The price needs to make a pullback into the 50 EMA .
Right after that, the Cipher B indicator must give a buy signal, it must be below the zero line and the Money Flow cloud must be green.
Short
Contrary to the premise of long positions.
EXIT
Lowest Low/ Highest High Exit
The Lowest Low (long) / highest high (short) serves as the stop loss. The TP is formed on the basis of a factor.
(Long for example: *Lowest Low* multiplied by *Profitfactor* = TP).
ATR Exit
The value of ATR at the time of buying is multiplied by the value entered in "Profit factor ATR" and "Stop factor ATR". As soon as the price reaches this value, it is closed.
Important
The script must be optimized for each coin or currency pair. However, only the values for the profit factor, the stop loss and Lowest Low / Highest High are relevant.
Also, by changing the Chanel Length and the Chanel Average, you can create strong profit changes.
The results of the strategy are without commissions and leverage.
If you have any questions or feedback, please let me know in the comments.
If you need more information about the strategy and want to know exactly how to apply it, check out my profile. There I have created a tutorial for the function of the script.
在腳本中搜尋"profit factor"

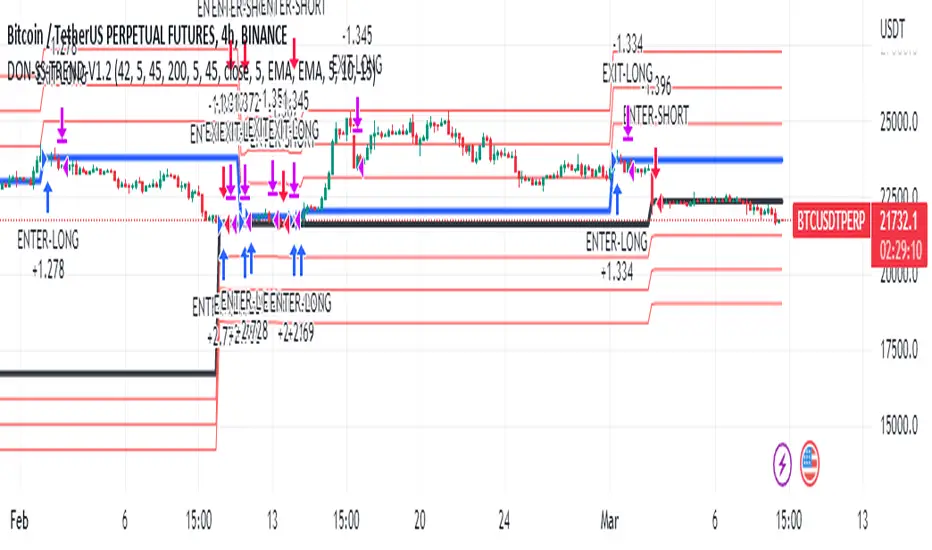
Donchian Trend V1The Donchian Trend strategy is a trend-following approach that uses the Donchian Channels indicator to identify potential entry and exit points in a security. The Donchian Channels are formed by taking the highest high and the lowest low prices over a specified period and plotting them as upper and lower channels around the current price. The width of the channels indicates the level of volatility in the market.
In this strategy, the Donchian Channels are used as a trend filter to determine the direction of the market. When the price is above the upper channel, it suggests an uptrend, and when the price is below the lower channel, it indicates a downtrend. The length of the Donchian Channels is a key parameter in the strategy, as it determines the look-back period for identifying the high and low prices.
Additional Logic: To further refine the entry and exit signals, The script uses two moving averages, a fast one (MA5) and a slow one (MA45), to identify trends and generate trading signals. When the fast moving average crosses above the slow moving average, a buy signal is generated, indicating that the market is trending upwards. Conversely, when the fast moving average crosses below the slow moving average, a sell signal is generated, indicating that the market is trending downwards.
Evaluation: The script was backtested on historical price data for the pair. The backtest results showed that the script was able to generate a net profit of , with a profit factor of and a Sharpe ratio of . The script also includes metrics such as the number of winning and losing trades, the average trade, and the largest winning and losing trades.
The strategy is evaluated based on its net profit, gross profit, gross loss, max run-up, max drawdown, buy & hold return, Sharpe ratio, Sortino ratio, and profit factor. The parameters used in the backtest include a Donchian Channel length of 42, which corresponds to a weekly time with divide of 4h time frame, and a short-term MA of 5 and a long-term MA of 45 for more accurate entry and exit signals.
Disclaimer: This script is for educational and research purposes only and should not be used for trading with real money without further testing and validation. Past performance is not indicative of future results.
KST Strategy [Skyrexio]Overview
KST Strategy leverages Know Sure Thing (KST) indicator in conjunction with the Williams Alligator and Moving average to obtain the high probability setups. KST is used for for having the high probability to enter in the direction of a current trend when momentum is rising, Alligator is used as a short term trend filter, while Moving average approximates the long term trend and allows trades only in its direction. Also strategy has the additional optional filter on Choppiness Index which does not allow trades if market is choppy, above the user-specified threshold. Strategy has the user specified take profit and stop-loss numbers, but multiplied by Average True Range (ATR) value on the moment when trade is open. The strategy opens only long trades.
Unique Features
ATR based stop-loss and take profit. Instead of fixed take profit and stop-loss percentage strategy utilizes user chosen numbers multiplied by ATR for its calculation.
Configurable Trading Periods. Users can tailor the strategy to specific market windows, adapting to different market conditions.
Optional Choppiness Index filter. Strategy allows to choose if it will use the filter trades with Choppiness Index and set up its threshold.
Methodology
The strategy opens long trade when the following price met the conditions:
Close price is above the Alligator's jaw line
Close price is above the filtering Moving average
KST line of Know Sure Thing indicator shall cross over its signal line (details in justification of methodology)
If the Choppiness Index filter is enabled its value shall be less than user defined threshold
When the long trade is executed algorithm defines the stop-loss level as the low minus user defined number, multiplied by ATR at the trade open candle. Also it defines take profit with close price plus user defined number, multiplied by ATR at the trade open candle. While trade is in progress, if high price on any candle above the calculated take profit level or low price is below the calculated stop loss level, trade is closed.
Strategy settings
In the inputs window user can setup the following strategy settings:
ATR Stop Loss (by default = 1.5, number of ATRs to calculate stop-loss level)
ATR Take Profit (by default = 3.5, number of ATRs to calculate take profit level)
Filter MA Type (by default = Least Squares MA, type of moving average which is used for filter MA)
Filter MA Length (by default = 200, length for filter MA calculation)
Enable Choppiness Index Filter (by default = true, setting to choose the optional filtering using Choppiness index)
Choppiness Index Threshold (by default = 50, Choppiness Index threshold, its value shall be below it to allow trades execution)
Choppiness Index Length (by default = 14, length used in Choppiness index calculation)
KST ROC Length #1 (by default = 10, value used in KST indicator calculation, more information in Justification of Methodology)
KST ROC Length #2 (by default = 15, value used in KST indicator calculation, more information in Justification of Methodology)
KST ROC Length #3 (by default = 20, value used in KST indicator calculation, more information in Justification of Methodology)
KST ROC Length #4 (by default = 30, value used in KST indicator calculation, more information in Justification of Methodology)
KST SMA Length #1 (by default = 10, value used in KST indicator calculation, more information in Justification of Methodology)
KST SMA Length #2 (by default = 10, value used in KST indicator calculation, more information in Justification of Methodology)
KST SMA Length #3 (by default = 10, value used in KST indicator calculation, more information in Justification of Methodology)
KST SMA Length #4 (by default = 15, value used in KST indicator calculation, more information in Justification of Methodology)
KST Signal Line Length (by default = 10, value used in KST indicator calculation, more information in Justification of Methodology)
User can choose the optimal parameters during backtesting on certain price chart.
Justification of Methodology
Before understanding why this particular combination of indicator has been chosen let's briefly explain what is KST, Williams Alligator, Moving Average, ATR and Choppiness Index.
The KST (Know Sure Thing) is a momentum oscillator developed by Martin Pring. It combines multiple Rate of Change (ROC) values, smoothed over different timeframes, to identify trend direction and momentum strength. First of all, what is ROC? ROC (Rate of Change) is a momentum indicator that measures the percentage change in price between the current price and the price a set number of periods ago.
ROC = 100 * (Current Price - Price N Periods Ago) / Price N Periods Ago
In our case N is the KST ROC Length inputs from settings, here we will calculate 4 different ROCs to obtain KST value:
KST = ROC1_smooth × 1 + ROC2_smooth × 2 + ROC3_smooth × 3 + ROC4_smooth × 4
ROC1 = ROC(close, KST ROC Length #1), smoothed by KST SMA Length #1,
ROC2 = ROC(close, KST ROC Length #2), smoothed by KST SMA Length #2,
ROC3 = ROC(close, KST ROC Length #3), smoothed by KST SMA Length #3,
ROC4 = ROC(close, KST ROC Length #4), smoothed by KST SMA Length #4
Also for this indicator the signal line is calculated:
Signal = SMA(KST, KST Signal Line Length)
When the KST line rises, it indicates increasing momentum and suggests that an upward trend may be developing. Conversely, when the KST line declines, it reflects weakening momentum and a potential downward trend. A crossover of the KST line above its signal line is considered a buy signal, while a crossover below the signal line is viewed as a sell signal. If the KST stays above zero, it indicates overall bullish momentum; if it remains below zero, it points to bearish momentum. The KST indicator smooths momentum across multiple timeframes, helping to reduce noise and provide clearer signals for medium- to long-term trends.
Next, let’s discuss the short-term trend filter, which combines the Williams Alligator and Williams Fractals. Williams Alligator
Developed by Bill Williams, the Alligator is a technical indicator that identifies trends and potential market reversals. It consists of three smoothed moving averages:
Jaw (Blue Line): The slowest of the three, based on a 13-period smoothed moving average shifted 8 bars ahead.
Teeth (Red Line): The medium-speed line, derived from an 8-period smoothed moving average shifted 5 bars forward.
Lips (Green Line): The fastest line, calculated using a 5-period smoothed moving average shifted 3 bars forward.
When the lines diverge and align in order, the "Alligator" is "awake," signaling a strong trend. When the lines overlap or intertwine, the "Alligator" is "asleep," indicating a range-bound or sideways market. This indicator helps traders determine when to enter or avoid trades.
The next indicator is Moving Average. It has a lot of different types which can be chosen to filter trades and the Least Squares MA is used by default settings. Let's briefly explain what is it.
The Least Squares Moving Average (LSMA) — also known as Linear Regression Moving Average — is a trend-following indicator that uses the least squares method to fit a straight line to the price data over a given period, then plots the value of that line at the most recent point. It draws the best-fitting straight line through the past N prices (using linear regression), and then takes the endpoint of that line as the value of the moving average for that bar. The LSMA aims to reduce lag and highlight the current trend more accurately than traditional moving averages like SMA or EMA.
Key Features:
It reacts faster to price changes than most moving averages.
It is smoother and less noisy than short-term EMAs.
It can be used to identify trend direction, momentum, and potential reversal points.
ATR (Average True Range) is a volatility indicator that measures how much an asset typically moves during a given period. It was introduced by J. Welles Wilder and is widely used to assess market volatility, not direction.
To calculate it first of all we need to get True Range (TR), this is the greatest value among:
High - Low
abs(High - Previous Close)
abs(Low - Previous Close)
ATR = MA(TR, n) , where n is number of periods for moving average, in our case equals 14.
ATR shows how much an asset moves on average per candle/bar. A higher ATR means more volatility; a lower ATR means a calmer market.
The Choppiness Index is a technical indicator that quantifies whether the market is trending or choppy (sideways). It doesn't indicate trend direction — only the strength or weakness of a trend. Higher Choppiness Index usually approximates the sideways market, while its low value tells us that there is a high probability of a trend.
Choppiness Index = 100 × log10(ΣATR(n) / (MaxHigh(n) - MinLow(n))) / log10(n)
where:
ΣATR(n) = sum of the Average True Range over n periods
MaxHigh(n) = highest high over n periods
MinLow(n) = lowest low over n periods
log10 = base-10 logarithm
Now let's understand how these indicators work in conjunction and why they were chosen for this strategy. KST indicator approximates current momentum, when it is rising and KST line crosses over the signal line there is high probability that short term trend is reversing to the upside and strategy allows to take part in this potential move. Alligator's jaw (blue) line is used as an approximation of a short term trend, taking trades only above it we want to avoid trading against trend to increase probability that long trade is going to be winning.
Almost the same for Moving Average, but it approximates the long term trend, this is just the additional filter. If we trade in the direction of the long term trend we increase probability that higher risk to reward trade will hit the take profit. Choppiness index is the optional filter, but if it turned on it is used for approximating if now market is in sideways or in trend. On the range bounded market the potential moves are restricted. We want to decrease probability opening trades in such condition avoiding trades if this index is above threshold value.
When trade is open script sets the stop loss and take profit targets. ATR approximates the current volatility, so we can make a decision when to exit a trade based on current market condition, it can increase the probability that strategy will avoid the excessive stop loss hits, but anyway user can setup how many ATRs to use as a stop loss and take profit target. As was said in the Methodology stop loss level is obtained by subtracting number of ATRs from trade opening candle low, while take profit by adding to this candle's close.
Backtest Results
Operating window: Date range of backtests is 2023.01.01 - 2025.05.01. It is chosen to let the strategy to close all opened positions.
Commission and Slippage: Includes a standard Binance commission of 0.1% and accounts for possible slippage over 5 ticks.
Initial capital: 10000 USDT
Percent of capital used in every trade: 60%
Maximum Single Position Loss: -5.53%
Maximum Single Profit: +8.35%
Net Profit: +5175.20 USDT (+51.75%)
Total Trades: 120 (56.67% win rate)
Profit Factor: 1.747
Maximum Accumulated Loss: 1039.89 USDT (-9.1%)
Average Profit per Trade: 43.13 USDT (+0.6%)
Average Trade Duration: 27 hours
These results are obtained with realistic parameters representing trading conditions observed at major exchanges such as Binance and with realistic trading portfolio usage parameters.
How to Use
Add the script to favorites for easy access.
Apply to the desired timeframe and chart (optimal performance observed on 1h BTC/USDT).
Configure settings using the dropdown choice list in the built-in menu.
Set up alerts to automate strategy positions through web hook with the text: {{strategy.order.alert_message}}
Disclaimer:
Educational and informational tool reflecting Skyrexio commitment to informed trading. Past performance does not guarantee future results. Test strategies in a simulated environment before live implementation.

[3Commas] Turtle StrategyTurtle Strategy
🔷 What it does: This indicator implements a modernized version of the Turtle Trading Strategy, designed for trend-following and automated trading with webhook integration. It identifies breakout opportunities using Donchian channels, providing entry and exit signals.
Channel 1: Detects short-term breakouts using the highest highs and lowest lows over a set period (default 20).
Channel 2: Acts as a confirmation filter by applying an offset to the same period, reducing false signals.
Exit Channel: Functions as a dynamic stop-loss (wait for candle close), adjusting based on market structure (default 10 periods).
Additionally, traders can enable a fixed Take Profit level, ensuring a systematic approach to profit-taking.
🔷 Who is it for:
Trend Traders: Those looking to capture long-term market moves.
Bot Users: Traders seeking to automate entries and exits with bot integration.
Rule-Based Traders: Operators who prefer a structured, systematic trading approach.
🔷 How does it work: The strategy generates buy and sell signals using a dual-channel confirmation system.
Long Entry: A buy signal is generated when the close price crosses above the previous high of Channel 1 and is confirmed by Channel 2.
Short Entry: A sell signal occurs when the close price falls below the previous low of Channel 1, with confirmation from Channel 2.
Exit Management: The Exit Channel acts as a trailing stop, dynamically adjusting to price movements. To exit the trade, wait for a full bar close.
Optional Take Profit (%): Closes trades at a predefined %.
🔷 Why it’s unique:
Modern Adaptation: Updates the classic Turtle Trading Strategy, with the possibility of using a second channel with an offset to filter the signals.
Dynamic Risk Management: Utilizes a trailing Exit Channel to help protect gains as trades move favorably.
Bot Integration: Automates trade execution through direct JSON signal communication with your DCA Bots.
🔷 Considerations Before Using the Indicator:
Market & Timeframe: Best suited for trending markets; higher timeframes (e.g., H4, D1) are recommended to minimize noise.
Sideways Markets: In choppy conditions, breakouts may lead to false signals—consider using additional filters.
Backtesting & Demo Testing: It is crucial to thoroughly backtest the strategy and run it on a demo account before risking real capital.
Parameter Adjustments: Ensure that commissions, slippage, and position sizes are set accurately to reflect real trading conditions.
🔷 STRATEGY PROPERTIES
Symbol: BINANCE:ETHUSDT (Spot).
Timeframe: 4h.
Test Period: All historical data available.
Initial Capital: 10000 USDT.
Order Size per Trade: 1% of Capital, you can use a higher value e.g. 5%, be cautious that the Max Drawdown does not exceed 10%, as it would indicate a very risky trading approach.
Commission: Binance commission 0.1%, adjust according to the exchange being used, lower numbers will generate unrealistic results. By using low values e.g. 5%, it allows us to adapt over time and check the functioning of the strategy.
Slippage: 5 ticks, for pairs with low liquidity or very large orders, this number should be increased as the order may not be filled at the desired level.
Margin for Long and Short Positions: 100%.
Indicator Settings: Default Configuration.
Period Channel 1: 20.
Period Channel 2: 20.
Period Channel 2 Offset: 20.
Period Exit: 10.
Take Profit %: Disable.
Strategy: Long & Short.
🔷 STRATEGY RESULTS
⚠️Remember, past results do not guarantee future performance.
Net Profit: +516.87 USDT (+5.17%).
Max Drawdown: -100.28 USDT (-0.95%).
Total Closed Trades: 281.
Percent Profitable: 40.21%.
Profit Factor: 1.704.
Average Trade: +1.84 USDT (+1.80%).
Average # Bars in Trades: 29.
🔷 How to Use It:
🔸 Adjust Settings:
Select your asset and timeframe suited for trend trading.
Adjust the periods for Channel 1, Channel 2, and the Exit Channel to align with the asset’s historical behavior. You can visualize these channels by going to the Style tab and enabling them.
For example, if you set Channel 2 to 40 with an offset of 40, signals will take longer to appear but will aim for a more defined trend.
Experiment with different values, a possible exit configuration is using 20 as well. Compare the results and adjust accordingly.
Enable the Take Profit (%) option if needed.
🔸Results Review:
It is important to check the Max Drawdown. This value should ideally not exceed 10% of your capital. Consider adjusting the trade size to ensure this threshold is not surpassed.
Remember to include the correct values for commission and slippage according to the symbol and exchange where you are conducting the tests. Otherwise, the results will not be realistic.
If you are satisfied with the results, you may consider automating your trades. However, it is strongly recommended to use a small amount of capital or a demo account to test proper execution before committing real funds.
🔸Create alerts to trigger the DCA Bot:
Verify Messages: Ensure the message matches the one specified by the DCA Bot.
Multi-Pair Configuration: For multi-pair setups, enable the option to add the symbol in the correct format.
Signal Settings: Enable the option to receive long or short signals (Entry | TP | SL), copy and paste the messages for the DCA Bots configured.
Alert Setup:
When creating an alert, set the condition to the indicator and choose "alert() function call only".
Enter any desired Alert Name.
Open the Notifications tab, enable Webhook URL, and paste the Webhook URL.
For more details, refer to the section: "How to use TradingView Custom Signals".
Finalize Alerts: Click Create, you're done! Alerts will now be sent automatically in the correct format.
🔷 INDICATOR SETTINGS
Period Channel 1: Period of highs and lows to trigger signals
Period Channel 2: Period of highs and lows to filter signals
Offset: Move Channel 2 to the right x bars to try to filter out the favorable signals.
Period Exit: It is the period of the Donchian channel that is used as trailing for the exits.
Strategy: Order Type direction in which trades are executed.
Take Profit %: When activated, the entered value will be used as the Take Profit in percentage from the entry price level.
Use Custom Test Period: When enabled signals only works in the selected time window. If disabled it will use all historical data available on the chart.
Test Start and End: Once the Custom Test Period is enabled, here you select the start and end date that you want to analyze.
Check Messages: Check Messages: Enable this option to review the messages that will be sent to the bot.
Entry | TP | SL: Enable this options to send Buy Entry, Take Profit (TP), and Stop Loss (SL) signals.
Deal Entry and Deal Exit: Copy and paste the message for the deal start signal and close order at Market Price of the DCA Bot. This is the message that will be sent with the alert to the Bot, you must verify that it is the same as the bot so that it can process properly.
DCA Bot Multi-Pair: You must activate it if you want to use the signals in a DCA Bot Multi-pair in the text box you must enter (using the correct format) the symbol in which you are creating the alert, you can check the format of each symbol when you create the bot.
👨🏻💻💭 We hope this tool helps enhance your trading. Your feedback is invaluable, so feel free to share any suggestions for improvements or new features you'd like to see implemented.
__
The information and publications within the 3Commas TradingView account are not meant to be and do not constitute financial, investment, trading, or other types of advice or recommendations supplied or endorsed by 3Commas and any of the parties acting on behalf of 3Commas, including its employees, contractors, ambassadors, etc.

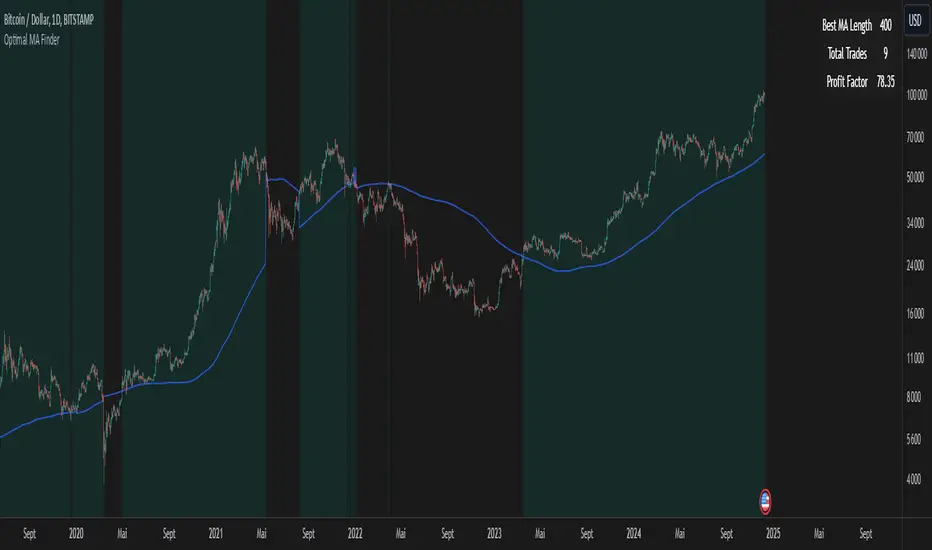
Optimal MA FinderIntroduction to the "Optimal MA Finder" Indicator
The "Optimal MA Finder" is a powerful and versatile tool designed to help traders optimize their moving average strategies. This script combines flexibility, precision, and automation to identify the most effective moving average (MA) length for your trading approach. Whether you're aiming to improve your long-only strategy or implement a buy-and-sell methodology, the "Optimal MA Finder" is your go-to solution for enhanced decision-making.
What Does It Do?
The script evaluates a wide range of moving average lengths, from 10 to 500, to determine which one produces the best results based on historical data. By calculating critical metrics such as the total number of trades and the profit factor for each MA length, it identifies the one that maximizes profitability. It supports both simple moving averages (SMA) and exponential moving averages (EMA), allowing you to tailor the analysis to your preferred method.
The logic works by backtesting each MA length against the price data and assessing the performance under two strategies:
Buy & Sell: Includes both long and short trades.
Long Only: Focuses solely on long positions for more conservative strategies.
Once the optimal MA length is identified, the script overlays it on the chart, highlighting periods when the price crosses over or under the optimal MA, helping traders identify potential entry and exit points.
Why Is It Useful?
This indicator stands out for its ability to automate a task that is often labor-intensive and subjective: finding the best MA length. By providing a clear, data-driven answer, it saves traders countless hours of manual testing while significantly enhancing the accuracy of their strategies. For example, instead of guessing whether a 50-period EMA is more effective than a 200-period SMA, the "Optimal MA Finder" will pinpoint the exact length and type of MA that has historically yielded the best results for your chosen strategy.
Key Benefits:
Precision: Identifies the MA length with the highest profit factor for maximum profitability.
Automation: Conducts thorough backtesting without manual effort.
Flexibility: Adapts to your preferred MA type (SMA or EMA) and trading strategy (Buy & Sell or Long Only).
Real-Time Feedback: Provides actionable insights by plotting the optimal MA directly on your chart and highlighting relevant trading periods.
Example of Use: Imagine you're trading a volatile stock and want to optimize your long-only strategy. By applying the "Optimal MA Finder," you discover that a 120-period EMA results in the highest profit factor. The indicator plots this EMA on your chart, showing you when to consider entering or exiting positions based on price movements relative to the EMA.
In short, the "Optimal MA Finder" empowers traders by delivering data-driven insights and improving the effectiveness of trading strategies. Its clear logic, combined with robust automation, makes it an invaluable tool for both novice and experienced traders seeking consistent results.
Optimized Heikin Ashi Strategy with Buy/Sell OptionsStrategy Name:
Optimized Heikin Ashi Strategy with Buy/Sell Options
Description:
The Optimized Heikin Ashi Strategy is a trend-following strategy designed to capitalize on market trends by utilizing the smoothness of Heikin Ashi candles. This strategy provides flexible options for trading, allowing users to choose between Buy Only (long-only), Sell Only (short-only), or using both in alternating conditions based on the Heikin Ashi candle signals. The strategy works on any market, but it performs especially well in markets where trends are prevalent, such as cryptocurrency or Forex.
This script offers customizable parameters for the backtest period, Heikin Ashi timeframe, stop loss, and take profit levels, allowing traders to optimize the strategy for their preferred markets or assets.
Key Features:
Trade Type Options:
Buy Only: Enter a long position when a green Heikin Ashi candle appears and exit when a red candle appears.
Sell Only: Enter a short position when a red Heikin Ashi candle appears and exit when a green candle appears.
Stop Loss and Take Profit:
Customizable stop loss and take profit percentages allow for flexible risk management.
The default stop loss is set to 2%, and the default take profit is set to 4%, maintaining a favorable risk/reward ratio.
Heikin Ashi Timeframe:
Traders can select the desired timeframe for Heikin Ashi candle calculation (e.g., 4-hour Heikin Ashi candles for a 1-hour chart).
The strategy smooths out price action and reduces noise, providing clearer signals for entry and exit.
Inputs:
Backtest Start Date / End Date: Specify the period for testing the strategy’s performance.
Heikin Ashi Timeframe: Select the timeframe for Heikin Ashi candle generation. A higher timeframe helps smooth the trend, which is beneficial for trading lower timeframes.
Stop Loss (in %) and Take Profit (in %): Enable or disable stop loss and take profit, and adjust the levels based on market conditions.
Trade Type: Choose between Buy Only or Sell Only based on your market outlook and strategy preference.
Strategy Performance:
In testing with BTC/USD, this strategy performed well in a 4-hour Heikin Ashi timeframe applied on a 1-hour chart over a period from January 1, 2024, to September 12, 2024. The results were as follows:
Initial Capital: 1 USD
Order Size: 100% of equity
Net Profit: +30.74 USD (3,073.52% return)
Percent Profitable: 78.28% of trades were winners.
Profit Factor: 15.825, indicating that the strategy's profitable trades far outweighed its losses.
Max Drawdown: 4.21%, showing low risk exposure relative to the large profit potential.
This strategy is ideal for both beginner and advanced traders who are looking to follow trends and avoid market noise by using Heikin Ashi candles. It is also well-suited for traders who prefer automated risk management through the use of stop loss and take profit levels.
Recommended Use:
Best Markets: This strategy works well on trending markets like cryptocurrency, Forex, or indices.
Timeframes: Works best when applied to lower timeframes (e.g., 1-hour chart) with a higher Heikin Ashi timeframe (e.g., 4-hour candles) to smooth out price action.
Leverage: The strategy performs well with leverage, but users should consider using 2x to 3x leverage to avoid excessive risk and potential liquidation. The strategy's low drawdown allows for moderate leverage use while maintaining risk control.
Customization: Traders can adjust the stop loss and take profit percentages based on their risk appetite and market conditions. A default setting of a 2% stop loss and 4% take profit provides a balanced risk/reward ratio.
Notes:
Risk Management: Traders should enable stop loss and take profit settings to maintain effective risk management and prevent large drawdowns during volatile market conditions.
Optimization: This strategy can be further optimized by adjusting the Heikin Ashi timeframe and risk parameters based on specific market conditions and assets.
Backtesting: The built-in backtesting functionality allows traders to test the strategy across different market conditions and historical data to ensure robustness before applying it to live trading.
How to Apply:
Select your preferred market and chart.
Choose the appropriate Heikin Ashi timeframe based on the chart's timeframe. (e.g., use 4-hour Heikin Ashi candles for 1-hour chart trends).
Adjust stop loss and take profit based on your risk management preference.
Run backtesting to evaluate its performance before applying it in live trading.
This strategy can be further modified and optimized based on personal trading style and market conditions. It’s important to monitor performance regularly and adjust settings as needed to align with market behavior.

RSI Trend Following StrategyOverview
The RSI Trend Following Strategy utilizes Relative Strength Index (RSI) to enter the trade for the potential trend continuation. It uses Stochastic indicator to check is the price is not in overbought territory and the MACD to measure the current price momentum. Moreover, it uses the 200-period EMA to filter the counter trend trades with the higher probability. The strategy opens only long trades.
Unique Features
Dynamic stop-loss system: Instead of fixed stop-loss level strategy utilizes average true range (ATR) multiplied by user given number subtracted from the position entry price as a dynamic stop loss level.
Configurable Trading Periods: Users can tailor the strategy to specific market windows, adapting to different market conditions.
Two layers trade filtering system: Strategy utilizes MACD and Stochastic indicators measure the current momentum and overbought condition and use 200-period EMA to filter trades against major trend.
Trailing take profit level: After reaching the trailing profit activation level script activates the trailing of long trade using EMA. More information in methodology.
Wide opportunities for strategy optimization: Flexible strategy settings allows users to optimize the strategy entries and exits for chosen trading pair and time frame.
Methodology
The strategy opens long trade when the following price met the conditions:
RSI is above 50 level.
MACD line shall be above the signal line
Both lines of Stochastic shall be not higher than 80 (overbought territory)
Candle’s low shall be above the 200 period EMA
When long trade is executed, strategy set the stop-loss level at the price ATR multiplied by user-given value below the entry price. This level is recalculated on every next candle close, adjusting to the current market volatility.
At the same time strategy set up the trailing stop validation level. When the price crosses the level equals entry price plus ATR multiplied by user-given value script starts to trail the price with trailing EMA(by default = 20 period). If price closes below EMA long trade is closed. When the trailing starts, script prints the label “Trailing Activated”.
Strategy settings
In the inputs window user can setup the following strategy settings:
ATR Stop Loss (by default = 1.75)
ATR Trailing Profit Activation Level (by default = 2.25)
MACD Fast Length (by default = 12, period of averaging fast MACD line)
MACD Fast Length (by default = 26, period of averaging slow MACD line)
MACD Signal Smoothing (by default = 9, period of smoothing MACD signal line)
Oscillator MA Type (by default = EMA, available options: SMA, EMA)
Signal Line MA Type (by default = EMA, available options: SMA, EMA)
RSI Length (by default = 14, period for RSI calculation)
Trailing EMA Length (by default = 20, period for EMA, which shall be broken close the trade after trailing profit activation)
Justification of Methodology
This trading strategy is designed to leverage a combination of technical indicators—Relative Strength Index (RSI), Moving Average Convergence Divergence (MACD), Stochastic Oscillator, and the 200-period Exponential Moving Average (EMA)—to determine optimal entry points for long trades. Additionally, the strategy uses the Average True Range (ATR) for dynamic risk management to adapt to varying market conditions. Let's look in details for which purpose each indicator is used for and why it is used in this combination.
Relative Strength Index (RSI) is a momentum indicator used in technical analysis to measure the speed and change of price movements in a financial market. It helps traders identify whether an asset is potentially overbought (overvalued) or oversold (undervalued), which can indicate a potential reversal or continuation of the current trend.
How RSI Works? RSI tracks the strength of recent price changes. It compares the average gains and losses over a specific period (usually 14 periods) to assess the momentum of an asset. Average gain is the average of all positive price changes over the chosen period. It reflects how much the price has typically increased during upward movements. Average loss is the average of all negative price changes over the same period. It reflects how much the price has typically decreased during downward movements.
RSI calculates these average gains and losses and compares them to create a value between 0 and 100. If the RSI value is above 70, the asset is generally considered overbought, meaning it might be due for a price correction or reversal downward. Conversely, if the RSI value is below 30, the asset is considered oversold, suggesting it could be poised for an upward reversal or recovery. RSI is a useful tool for traders to determine market conditions and make informed decisions about entering or exiting trades based on the perceived strength or weakness of an asset's price movements.
This strategy uses RSI as a short-term trend approximation. If RSI crosses over 50 it means that there is a high probability of short-term trend change from downtrend to uptrend. Therefore RSI above 50 is our first trend filter to look for a long position.
The MACD (Moving Average Convergence Divergence) is a popular momentum and trend-following indicator used in technical analysis. It helps traders identify changes in the strength, direction, momentum, and duration of a trend in an asset's price.
The MACD consists of three components:
MACD Line: This is the difference between a short-term Exponential Moving Average (EMA) and a long-term EMA, typically calculated as: MACD Line = 12 period EMA − 26 period EMA
Signal Line: This is a 9-period EMA of the MACD Line, which helps to identify buy or sell signals. When the MACD Line crosses above the Signal Line, it can be a bullish signal (suggesting a buy); when it crosses below, it can be a bearish signal (suggesting a sell).
Histogram: The histogram shows the difference between the MACD Line and the Signal Line, visually representing the momentum of the trend. Positive histogram values indicate increasing bullish momentum, while negative values indicate increasing bearish momentum.
This strategy uses MACD as a second short-term trend filter. When MACD line crossed over the signal line there is a high probability that uptrend has been started. Therefore MACD line above signal line is our additional short-term trend filter. In conjunction with RSI it decreases probability of following false trend change signals.
The Stochastic Indicator is a momentum oscillator that compares a security's closing price to its price range over a specific period. It's used to identify overbought and oversold conditions. The indicator ranges from 0 to 100, with readings above 80 indicating overbought conditions and readings below 20 indicating oversold conditions.
It consists of two lines:
%K: The main line, calculated using the formula (CurrentClose−LowestLow)/(HighestHigh−LowestLow)×100 . Highest and lowest price taken for 14 periods.
%D: A smoothed moving average of %K, often used as a signal line.
This strategy uses stochastic to define the overbought conditions. The logic here is the following: we want to avoid long trades in the overbought territory, because when indicator reaches it there is a high probability that the potential move is gonna be restricted.
The 200-period EMA is a widely recognized indicator for identifying the long-term trend direction. The strategy only trades in the direction of this primary trend to increase the probability of successful trades. For instance, when the price is above the 200 EMA, only long trades are considered, aligning with the overarching trend direction.
Therefore, strategy uses combination of RSI and MACD to increase the probability that price now is in short-term uptrend, Stochastic helps to avoid the trades in the overbought (>80) territory. To increase the probability of opening long trades in the direction of a main trend and avoid local bounces we use 200 period EMA.
ATR is used to adjust the strategy risk management to the current market volatility. If volatility is low, we don’t need the large stop loss to understand the there is a high probability that we made a mistake opening the trade. User can setup the settings ATR Stop Loss and ATR Trailing Profit Activation Level to realize his own risk to reward preferences, but the unique feature of a strategy is that after reaching trailing profit activation level strategy is trying to follow the trend until it is likely to be finished instead of using fixed risk management settings. It allows sometimes to be involved in the large movements.
Backtest Results
Operating window: Date range of backtests is 2023.01.01 - 2024.08.01. It is chosen to let the strategy to close all opened positions.
Commission and Slippage: Includes a standard Binance commission of 0.1% and accounts for possible slippage over 5 ticks.
Initial capital: 10000 USDT
Percent of capital used in every trade: 30%
Maximum Single Position Loss: -3.94%
Maximum Single Profit: +15.78%
Net Profit: +1359.21 USDT (+13.59%)
Total Trades: 111 (36.04% win rate)
Profit Factor: 1.413
Maximum Accumulated Loss: 625.02 USDT (-5.85%)
Average Profit per Trade: 12.25 USDT (+0.40%)
Average Trade Duration: 40 hours
These results are obtained with realistic parameters representing trading conditions observed at major exchanges such as Binance and with realistic trading portfolio usage parameters.
How to Use
Add the script to favorites for easy access.
Apply to the desired timeframe and chart (optimal performance observed on 2h BTC/USDT).
Configure settings using the dropdown choice list in the built-in menu.
Set up alerts to automate strategy positions through web hook with the text: {{strategy.order.alert_message}}
Disclaimer:
Educational and informational tool reflecting Skyrex commitment to informed trading. Past performance does not guarantee future results. Test strategies in a simulated environment before live implementation

MACD with 1D Stochastic Confirmation Reversal StrategyOverview
The MACD with 1D Stochastic Confirmation Reversal Strategy utilizes MACD indicator in conjunction with 1 day timeframe Stochastic indicators to obtain the high probability short-term trend reversal signals. The main idea is to wait until MACD line crosses up it’s signal line, at the same time Stochastic indicator on 1D time frame shall show the uptrend (will be discussed in methodology) and not to be in the oversold territory. Strategy works on time frames from 30 min to 4 hours and opens only long trades.
Unique Features
Dynamic stop-loss system: Instead of fixed stop-loss level strategy utilizes average true range (ATR) multiplied by user given number subtracted from the position entry price as a dynamic stop loss level.
Configurable Trading Periods: Users can tailor the strategy to specific market windows, adapting to different market conditions.
Higher time frame confirmation: Strategy utilizes 1D Stochastic to establish the major trend and confirm the local reversals with the higher probability.
Trailing take profit level: After reaching the trailing profit activation level scrip activate the trailing of long trade using EMA. More information in methodology.
Methodology
The strategy opens long trade when the following price met the conditions:
MACD line of MACD indicator shall cross over the signal line of MACD indicator.
1D time frame Stochastic’s K line shall be above the D line.
1D time frame Stochastic’s K line value shall be below 80 (not overbought)
When long trade is executed, strategy set the stop-loss level at the price ATR multiplied by user-given value below the entry price. This level is recalculated on every next candle close, adjusting to the current market volatility.
At the same time strategy set up the trailing stop validation level. When the price crosses the level equals entry price plus ATR multiplied by user-given value script starts to trail the price with EMA. If price closes below EMA long trade is closed. When the trailing starts, script prints the label “Trailing Activated”.
Strategy settings
In the inputs window user can setup the following strategy settings:
ATR Stop Loss (by default = 3.25, value multiplied by ATR to be subtracted from position entry price to setup stop loss)
ATR Trailing Profit Activation Level (by default = 4.25, value multiplied by ATR to be added to position entry price to setup trailing profit activation level)
Trailing EMA Length (by default = 20, period for EMA, when price reached trailing profit activation level EMA will stop out of position if price closes below it)
User can choose the optimal parameters during backtesting on certain price chart, in our example we use default settings.
Justification of Methodology
This strategy leverages 2 time frames analysis to have the high probability reversal setups on lower time frame in the direction of the 1D time frame trend. That’s why it’s recommended to use this strategy on 30 min – 4 hours time frames.
To have an approximation of 1D time frame trend strategy utilizes classical Stochastic indicator. The Stochastic Indicator is a momentum oscillator that compares a security's closing price to its price range over a specific period. It's used to identify overbought and oversold conditions. The indicator ranges from 0 to 100, with readings above 80 indicating overbought conditions and readings below 20 indicating oversold conditions.
It consists of two lines:
%K: The main line, calculated using the formula (CurrentClose−LowestLow)/(HighestHigh−LowestLow)×100 . Highest and lowest price taken for 14 periods.
%D: A smoothed moving average of %K, often used as a signal line.
Strategy logic assumes that on 1D time frame it’s uptrend in %K line is above the %D line. Moreover, we can consider long trade only in %K line is below 80. It means that in overbought state the long trade will not be opened due to higher probability of pullback or even major trend reversal. If these conditions are met we are going to our working (lower) time frame.
On the chosen time frame, we remind you that for correct work of this strategy you shall use 30min – 4h time frames, MACD line shall cross over it’s signal line. The MACD (Moving Average Convergence Divergence) is a popular momentum and trend-following indicator used in technical analysis. It helps traders identify changes in the strength, direction, momentum, and duration of a trend in a stock's price.
The MACD consists of three components:
MACD Line: This is the difference between a short-term Exponential Moving Average (EMA) and a long-term EMA, typically calculated as: MACD Line=12-period EMA−26-period
Signal Line: This is a 9-period EMA of the MACD Line, which helps to identify buy or sell signals. When the MACD Line crosses above the Signal Line, it can be a bullish signal (suggesting a buy); when it crosses below, it can be a bearish signal (suggesting a sell).
Histogram: The histogram shows the difference between the MACD Line and the Signal Line, visually representing the momentum of the trend. Positive histogram values indicate increasing bullish momentum, while negative values indicate increasing bearish momentum.
In our script we are interested in only MACD and signal lines. When MACD line crosses signal line there is a high chance that short-term trend reversed to the upside. We use this strategy on 45 min time frame.
ATR is used to adjust the strategy risk management to the current market volatility. If volatility is low, we don’t need the large stop loss to understand the there is a high probability that we made a mistake opening the trade. User can setup the settings ATR Stop Loss and ATR Trailing Profit Activation Level to realize his own risk to reward preferences, but the unique feature of a strategy is that after reaching trailing profit activation level strategy is trying to follow the trend until it is likely to be finished instead of using fixed risk management settings. It allows sometimes to be involved in the large movements.
Backtest Results
Operating window: Date range of backtests is 2023.01.01 - 2024.08.01. It is chosen to let the strategy to close all opened positions.
Commission and Slippage: Includes a standard Binance commission of 0.1% and accounts for possible slippage over 5 ticks.
Initial capital: 10000 USDT
Percent of capital used in every trade: 30%
Maximum Single Position Loss: -4.79%
Maximum Single Profit: +20.14%
Net Profit: +2361.33 USDT (+44.72%)
Total Trades: 123 (44.72% win rate)
Profit Factor: 1.623
Maximum Accumulated Loss: 695.80 USDT (-5.48%)
Average Profit per Trade: 19.20 USDT (+0.59%)
Average Trade Duration: 30 hours
These results are obtained with realistic parameters representing trading conditions observed at major exchanges such as Binance and with realistic trading portfolio usage parameters.
How to Use
Add the script to favorites for easy access.
Apply to the desired timeframe between 30 min and 4 hours and chart (optimal performance observed on 45 min BTC/USDT).
Configure settings using the dropdown choice list in the built-in menu.
Set up alerts to automate strategy positions through web hook with the text: {{strategy.order.alert_message}}
Disclaimer:
Educational and informational tool reflecting Skyrex commitment to informed trading. Past performance does not guarantee future results. Test strategies in a simulated environment before live implementation

Double CCI Confirmed Hull Moving Average Reversal StrategyOverview
The Double CCI Confirmed Hull Moving Average Strategy utilizes hull moving average (HMA) in conjunction with two commodity channel index (CCI) indicators: the slow and fast to increase the probability of entering when the short and mid-term uptrend confirmed. The main idea is to wait until the price breaks the HMA while both CCI are showing that the uptrend has likely been already started. Moreover, strategy uses exponential moving average (EMA) to trail the price when it reaches the specific level. The strategy opens only long trades.
Unique Features
Dynamic stop-loss system: Instead of fixed stop-loss level strategy utilizes average true range (ATR) multiplied by user given number subtracted from the position entry price as a dynamic stop loss level.
Configurable Trading Periods: Users can tailor the strategy to specific market windows, adapting to different market conditions.
Double trade setup confirmation: Strategy utilizes two different period CCI indicators to confirm the breakouts of HMA.
Trailing take profit level: After reaching the trailing profit activation level scrip activate the trailing of long trade using EMA. More information in methodology.
Methodology
The strategy opens long trade when the following price met the conditions:
Short-term period CCI indicator shall be above 0.
Long-term period CCI indicator shall be above 0.
Price shall cross the HMA and candle close above it with the same candle
When long trade is executed, strategy set the stop-loss level at the price ATR multiplied by user-given value below the entry price. This level is recalculated on every next candle close, adjusting to the current market volatility.
At the same time strategy set up the trailing stop validation level. When the price crosses the level equals entry price plus ATR multiplied by user-given value script starts to trail the price with EMA. If price closes below EMA long trade is closed. When the trailing starts, script prints the label “Trailing Activated”.
Strategy settings
In the inputs window user can setup the following strategy settings:
ATR Stop Loss (by default = 1.75)
ATR Trailing Profit Activation Level (by default = 2.25)
CCI Fast Length (by default = 25, used for calculation short term period CCI
CCI Slow Length (by default = 50, used for calculation long term period CCI)
Hull MA Length (by default = 34, period of HMA, which shall be broken to open trade)
Trailing EMA Length (by default = 20)
User can choose the optimal parameters during backtesting on certain price chart.
Justification of Methodology
Before understanding why this particular combination of indicator has been chosen let's briefly explain what is CCI and HMA.
The Commodity Channel Index (CCI) is a momentum-based technical indicator used in trading to measure a security's price relative to its average price over a given period. Developed by Donald Lambert in 1980, the CCI is primarily used to identify cyclical trends in a security, helping traders to spot potential buying or selling opportunities.
The CCI formula is:
CCI = (Typical Price − SMA) / (0.015 × Mean Deviation)
Typical Price (TP): This is calculated as the average of the high, low, and closing prices for the period.
Simple Moving Average (SMA): This is the average of the Typical Prices over a specific number of periods.
Mean Deviation: This is the average of the absolute differences between the Typical Price and the SMA.
The result is a value that typically fluctuates between +100 and -100, though it is not bounded and can go higher or lower depending on the price movement.
The Hull Moving Average (HMA) is a type of moving average that was developed by Alan Hull to improve upon the traditional moving averages by reducing lag while maintaining smoothness. The goal of the HMA is to create an indicator that is both quick to respond to price changes and less prone to whipsaws (false signals).
How the Hull Moving Average is Calculated?
The Hull Moving Average is calculated using the following steps:
Weighted Moving Average (WMA): The HMA starts by calculating the Weighted Moving Average (WMA) of the price data over a period square root of n (sqrt(n))
Speed Adjustment: A WMA is then calculated for half of the period n/2, and this is multiplied by 2 to give more weight to recent prices.
Lag Reduction: The WMA of the full period n is subtracted from the doubled n/2 WMA.
Final Smoothing: To smooth the result and reduce noise, a WMA is calculated for the square root of the period n.
The formula can be represented as:
HMA(n) = WMA(WMA(n/2) × 2 − WMA(n), sqrt(n))
The Weighted Moving Average (WMA) is a type of moving average that gives more weight to recent data points, making it more responsive to recent price changes than a Simple Moving Average (SMA). In a WMA, each data point within the selected period is multiplied by a weight, with the most recent data receiving the highest weight. The sum of these weighted values is then divided by the sum of the weights to produce the WMA.
This strategy leverages HMA of user given period as a critical level which shall be broken to say that probability of trend change to the upside increased. HMA reacts faster than EMA or SMA to the price change, that’s why it increases chances to enter new trade earlier. Long-term period CCI helps to have an approximation of mid-term trend. If it’s above 0 the probability of uptrend increases. Short-period CCI allows to have an approximation of short-term trend reversal from down to uptrend. This approach increases chances to have a long trade setup in the direction of mid-term trend when the short-term trend starts to reverse.
ATR is used to adjust the strategy risk management to the current market volatility. If volatility is low, we don’t need the large stop loss to understand the there is a high probability that we made a mistake opening the trade. User can setup the settings ATR Stop Loss and ATR Trailing Profit Activation Level to realize his own risk to reward preferences, but the unique feature of a strategy is that after reaching trailing profit activation level strategy is trying to follow the trend until it is likely to be finished instead of using fixed risk management settings. It allows sometimes to be involved in the large movements. It’s also important to make a note, that script uses HMA to enter the trade, but for trailing it leverages EMA. It’s used because EMA has no such fast reaction to price move which increases probability not to be stopped out from any significant uptrend move.
Backtest Results
Operating window: Date range of backtests is 2022.07.01 - 2024.08.01. It is chosen to let the strategy to close all opened positions.
Commission and Slippage: Includes a standard Binance commission of 0.1% and accounts for possible slippage over 5 ticks.
Initial capital: 10000 USDT
Percent of capital used in every trade: 100%
Maximum Single Position Loss: -4.67%
Maximum Single Profit: +19.66%
Net Profit: +14897.94 USDT (+148.98%)
Total Trades: 104 (36.54% win rate)
Profit Factor: 2.312
Maximum Accumulated Loss: 1302.66 USDT (-9.58%)
Average Profit per Trade: 143.25 USDT (+0.96%)
Average Trade Duration: 34 hours
These results are obtained with realistic parameters representing trading conditions observed at major exchanges such as Binance and with realistic trading portfolio usage parameters.
How to Use
Add the script to favorites for easy access.
Apply to the desired timeframe and chart (optimal performance observed on 2h BTC/USDT).
Configure settings using the dropdown choice list in the built-in menu.
Set up alerts to automate strategy positions through web hook with the text: {{strategy.order.alert_message}}
Disclaimer:
Educational and informational tool reflecting Skyrex commitment to informed trading. Past performance does not guarantee future results. Test strategies in a simulated environment before live implementation

Bollinger Bands Enhanced StrategyOverview
The common practice of using Bollinger bands is to use it for building mean reversion or squeeze momentum strategies. In the current script Bollinger Bands Enhanced Strategy we are trying to combine the strengths of both strategies types. It utilizes Bollinger Bands indicator to buy the local dip and activates trailing profit system after reaching the user given number of Average True Ranges (ATR). Also it uses 200 period EMA to filter trades only in the direction of a trend. Strategy can execute only long trades.
Unique Features
Trailing Profit System: Strategy uses user given number of ATR to activate trailing take profit. If price has already reached the trailing profit activation level, scrip will close long trade if price closes below Bollinger Bands middle line.
Configurable Trading Periods: Users can tailor the strategy to specific market windows, adapting to different market conditions.
Major Trend Filter: Strategy utilizes 100 period EMA to take trades only in the direction of a trend.
Flexible Risk Management: Users can choose number of ATR as a stop loss (by default = 1.75) for trades. This is flexible approach because ATR is recalculated on every candle, therefore stop-loss readjusted to the current volatility.
Methodology
First of all, script checks if currently price is above the 200-period exponential moving average EMA. EMA is used to establish the current trend. Script will take long trades on if this filtering system showing us the uptrend. Then the strategy executes the long trade if candle’s low below the lower Bollinger band. To calculate the middle Bollinger line, we use the standard 20-period simple moving average (SMA), lower band is calculated by the substruction from middle line the standard deviation multiplied by user given value (by default = 2).
When long trade executed, script places stop-loss at the price level below the entry price by user defined number of ATR (by default = 1.75). This stop-loss level recalculates at every candle while trade is open according to the current candle ATR value. Also strategy set the trailing profit activation level at the price above the position average price by user given number of ATR (by default = 2.25). It is also recalculated every candle according to ATR value. When price hit this level script plotted the triangle with the label “Strong Uptrend” and start trail the price at the middle Bollinger line. It also started to be plotted as a green line.
When price close below this trailing level script closes the long trade and search for the next trade opportunity.
Risk Management
The strategy employs a combined and flexible approach to risk management:
It allows positions to ride the trend as long as the price continues to move favorably, aiming to capture significant price movements. It features a user-defined ATR stop loss parameter to mitigate risks based on individual risk tolerance. By default, this stop-loss is set to a 1.75*ATR drop from the entry point, but it can be adjusted according to the trader's preferences.
There is no fixed take profit, but strategy allows user to define user the ATR trailing profit activation parameter. By default, this stop-loss is set to a 2.25*ATR growth from the entry point, but it can be adjusted according to the trader's preferences.
Justification of Methodology
This strategy leverages Bollinger bangs indicator to open long trades in the local dips. If price reached the lower band there is a high probability of bounce. Here is an issue: during the strong downtrend price can constantly goes down without any significant correction. That’s why we decided to use 200-period EMA as a trend filter to increase the probability of opening long trades during major uptrend only.
Usually, Bollinger Bands indicator is using for mean reversion or breakout strategies. Both of them have the disadvantages. The mean reversion buys the dip, but closes on the return to some mean value. Therefore, it usually misses the major trend moves. The breakout strategies usually have the issue with too high buy price because to have the breakout confirmation price shall break some price level. Therefore, in such strategies traders need to set the large stop-loss, which decreases potential reward to risk ratio.
In this strategy we are trying to combine the best features of both types of strategies. Script utilizes ate ATR to setup the stop-loss and trailing profit activation levels. ATR takes into account the current volatility. Therefore, when we setup stop-loss with the user-given number of ATR we increase the probability to decrease the number of false stop outs. The trailing profit concept is trying to add the beat feature from breakout strategies and increase probability to stay in trade while uptrend is developing. When price hit the trailing profit activation level, script started to trail the price with middle line if Bollinger bands indicator. Only when candle closes below the middle line script closes the long trade.
Backtest Results
Operating window: Date range of backtests is 2020.10.01 - 2024.07.01. It is chosen to let the strategy to close all opened positions.
Commission and Slippage: Includes a standard Binance commission of 0.1% and accounts for possible slippage over 5 ticks.
Initial capital: 10000 USDT
Percent of capital used in every trade: 30%
Maximum Single Position Loss: -9.78%
Maximum Single Profit: +25.62%
Net Profit: +6778.11 USDT (+67.78%)
Total Trades: 111 (48.65% win rate)
Profit Factor: 2.065
Maximum Accumulated Loss: 853.56 USDT (-6.60%)
Average Profit per Trade: 61.06 USDT (+1.62%)
Average Trade Duration: 76 hours
These results are obtained with realistic parameters representing trading conditions observed at major exchanges such as Binance and with realistic trading portfolio usage parameters.
How to Use
Add the script to favorites for easy access.
Apply to the desired timeframe and chart (optimal performance observed on 4h BTC/USDT).
Configure settings using the dropdown choice list in the built-in menu.
Set up alerts to automate strategy positions through web hook with the text: {{strategy.order.alert_message}}
Disclaimer:
Educational and informational tool reflecting Skyrex commitment to informed trading. Past performance does not guarantee future results. Test strategies in a simulated environment before live implementation

RSI on VWAP Upgraded strategyFirst of all, the idea of apply RSI to VWAP was inspired by XaviZ; at least, that where I first saw that.
I simply applied the idea and searched for apply this on lower timeframe (M15) to increase the number of positions and improve the profit factor.
The conditions to enter are the same :
long : enter on RSI crossover oversold level
short : enter on RSI crossunder oversell level
To close position, I found a little change to apply :
long : close position when RSI(VWAP) went in overbought zone and crossunder the overbought level OR after being at least x bars in the overbought zone (parameter is 28 by default) => when the first condition happens
short : close position when RSI(VWAP) went in oversold zone and crossover the oversold level OR after being at least x bars in the oversell zone (parameter is 28 by default) => when the first condition happens
With this change, I got better results specially on BTCUSDTPERP (M15) where I reach a 6.8 profit factor with 119 trades closed. Not BAD !
The defaults parameters are the best found for BTCUSDTPERP (M15), but the strategy works fine for other pairs if you take time to find the rights combinations.
In this strategy you can change (with defaults in () ):
RSI length (28)
RSI overbought level (85)
RSI oversell level (30)
Number of bars before leaving as explain above (28)
The choice to take longs only, shorts only or both
The number of coin/token by position
The start date for backtesting
Please note that the script use a pyramiding parameter of 3 (can be changed in the first line of the script); that means that you can take up to 3 positions before closing. It lets you improve average enter price but increase the risk. 3 is the best I found to improve profit factor without expose myself too much.
This script would be better if automated because of the conditions of buy and sell.
It's only for educative purpose, not an advice to invest.
All my free scripts here : fr.tradingview.com
Leave a message and don't forget to follow me ;) !

VDN2 - SuperTrend + ADX + Stochastic StrategySuperTrend + ADX + Stochastic
Overview:
A trend-following and momentum-confirmation strategy using SuperTrend, ADX (>20 filter), and Stochastic oscillator. Optimized for Gold (XAUUSD) on the 10-minute chart.
Backtest Highlights (Last 1 Week):
Win Rate: 83.3% (5 out of 6 trades)
Net Profit: +56.35 USD (1 contract size)
Avg Trade Duration: ~58 bars (~9.6 hours)
Max Drawdown: 16.65 USD
Avg Win: 9.24 USD, Avg Loss: 0.82 USD
Largest Single Profit: 23.28 USD
Profit Factor: ~11.27
Core Logic:
Enter Long when:
* SuperTrend is bullish
* ADX > 20
* Stochastic %K > %D and %K < 80
Enter Short when:
* SuperTrend is bearish
* ADX > 20
* Stochastic %K < %D and %K > 20
No fixed TP/SL. Positions closed on signal reversal.

SuperTrend + ADX + Stochastic Stratejisi SuperTrend + ADX + Stochastic
Overview:
A trend-following and momentum-confirmation strategy using SuperTrend, ADX (>20 filter), and Stochastic oscillator. Optimized for Gold (XAUUSD) on the 10-minute chart.
Backtest Highlights (Last 1 Week):
Win Rate: 83.3% (5 out of 6 trades)
Net Profit: +56.35 USD (1 contract size)
Avg Trade Duration: ~58 bars (~9.6 hours)
Max Drawdown: 16.65 USD
Avg Win: 9.24 USD, Avg Loss: 0.82 USD
Largest Single Profit: 23.28 USD
Profit Factor: ~11.27
Core Logic:
Enter Long when:
* SuperTrend is bullish
* ADX > 20
* Stochastic %K > %D and %K < 80
Enter Short when:
* SuperTrend is bearish
* ADX > 20
* Stochastic %K < %D and %K > 20
No fixed TP/SL.
Positions closed on signal reversal.

Canuck Trading Trader StrategyCanuck Trading Trader Strategy
Overview
The Canuck Trading Trader Strategy is a high-performance, trend-following trading system designed for NASDAQ:TSLA on a 15-minute timeframe. Optimized for precision and profitability, this strategy leverages short-term price trends to capture consistent gains while maintaining robust risk management. Ideal for traders seeking an automated, data-driven approach to trading Tesla’s volatile market, it delivers strong returns with controlled drawdowns.
Key Features
Trend-Based Entries: Identifies short-term trends using a 2-candle lookback period and a minimum trend strength of 0.2%, ensuring responsive trade signals.
Risk Management: Includes a configurable 3.0% stop-loss to cap losses and a 2.0% take-profit to lock in gains, balancing risk and reward.
High Precision: Utilizes bar magnification for accurate backtesting, reflecting realistic trade execution with 1-tick slippage and 0.1 commission.
Clean Interface: No on-chart indicators, providing a distraction-free trading experience focused on performance.
Flexible Sizing: Allocates 10% of equity per trade with support for up to 2 simultaneous positions (pyramiding).
Performance Highlights
Backtested from March 1, 2024, to June 20, 2025, on NASDAQ:TSLA (15-minute timeframe) with $1,000,000 initial capital:
Net Profit: $2,279,888.08 (227.99%)
Win Rate: 52.94% (3,039 winning trades out of 5,741)
Profit Factor: 3.495
Max Drawdown: 2.20%
Average Winning Trade: $1,050.91 (0.55%)
Average Losing Trade: $338.20 (0.18%)
Sharpe Ratio: 2.468
Note: Past performance is not indicative of future results. Always validate with your own backtesting and forward testing.
Usage Instructions
Setup:
Apply the strategy to a NASDAQ:TSLA 15-minute chart.
Ensure your TradingView account supports bar magnification for accurate results.
Configuration:
Lookback Candles: Default is 2 (recommended).
Min Trend Strength: Set to 0.2% for optimal trade frequency.
Stop Loss: Default 3.0% to cap losses.
Take Profit: Default 2.0% to secure gains.
Order Size: 10% of equity per trade.
Pyramiding: Allows up to 2 orders.
Commission: Set to 0.1.
Slippage: Set to 1 tick.
Enable "Recalculate After Order is Filled" and "Recalculate on Every Tick" in backtest settings.
Backtesting:
Run backtests over March 1, 2024, to June 20, 2025, to verify performance.
Adjust stop-loss (e.g., 2.5%) or take-profit (e.g., 1–3%) to suit your risk tolerance.
Live Trading:
Use with a compatible broker or TradingView alerts for automated execution.
Monitor execution for slippage or latency, especially given the high trade frequency (5,741 trades).
Validate in a demo account before deploying with real capital.
Risk Disclosure
Trading involves significant risk and may result in losses exceeding your initial capital. The Canuck Trading Trader Strategy is provided for educational and informational purposes only. Users are responsible for their own trading decisions and should conduct thorough testing before using in live markets. The strategy’s high trade frequency requires reliable execution infrastructure to minimize slippage and latency.

PowerZone Trading StrategyExplanation of the PowerZone Trading Strategy for Your Users
The PowerZone Trading Strategy is an automated trading strategy that detects strong price movements (called "PowerZones") and generates signals to enter a long (buy) or short (sell) position, complete with predefined take profit and stop loss levels. Here’s how it works, step by step:
1. What is a PowerZone?
A "PowerZone" (PZ) is a zone on the chart where the price has shown a significant and consistent movement over a specific number of candles (bars). There are two types:
Bullish PowerZone (Bullish PZ): Occurs when the price rises consistently over several candles after an initial bearish candle.
Bearish PowerZone (Bearish PZ): Occurs when the price falls consistently over several candles after an initial bullish candle.
The code analyzes:
A set number of candles (e.g., 5, adjustable via "Periods").
A minimum percentage move (adjustable via "Min % Move for PowerZone") to qualify as a strong zone.
Whether to use the full candle range (highs and lows) or just open/close prices (toggle with "Use Full Range ").
2. How Does It Detect PowerZones?
Bullish PowerZone:
Looks for an initial bearish candle (close below open).
Checks that the next candles (e.g., 5) are all bullish (close above open).
Ensures the total price movement exceeds the minimum percentage set.
Defines a range: from the high (or open) to the low of the initial candle.
Bearish PowerZone:
Looks for an initial bullish candle (close above open).
Checks that the next candles are all bearish (close below open).
Ensures the total price movement exceeds the minimum percentage.
Defines a range: from the high to the low (or close) of the initial candle.
These zones are drawn on the chart with lines: green or white for bullish, red or blue for bearish, depending on the color scheme ("DARK" or "BRIGHT").
3. When Does It Enter a Trade?
The strategy waits for a breakout from the PowerZone range to enter a trade:
Buy (Long): When the price breaks above the high of a Bullish PowerZone.
Sell (Short): When the price breaks below the low of a Bearish PowerZone.
The position size is set to 100% of available equity (adjustable in the code).
4. Take Profit and Stop Loss
Take Profit (TP): Calculated as a multiple (adjustable via "Take Profit Factor," default 1.5) of the PowerZone height. For example:
For a buy, TP = Entry price + (PZ height × 1.5).
For a sell, TP = Entry price - (PZ height × 1.5).
Stop Loss (SL): Calculated as a multiple (adjustable via "Stop Loss Factor," default 1.0) of the PZ height, placed below the range for buys or above for sells.
5. Visualization on the Chart
PowerZones are displayed with lines on the chart (you can hide them with "Show Bullish Channel" or "Show Bearish Channel").
An optional info panel ("Show Info Panel") displays key levels: PZ high and low, TP, and SL.
You can also enable brief documentation on the chart ("Show Documentation") explaining the basic rules.
6. Alerts
The code generates automatic alerts in TradingView:
For a bullish breakout: "Bullish PowerZone Breakout - LONG!"
For a bearish breakdown: "Bearish PowerZone Breakdown - SHORT!"
7. Customization
You can tweak:
The number of candles to detect a PZ ("Periods").
The minimum percentage move ("Min % Move").
Whether to use highs/lows or just open/close ("Use Full Range").
The TP and SL factors.
The color scheme and what elements to display on the chart.
Practical Example
Imagine you set "Periods = 5" and "Min % Move = 2%":
An initial bearish candle appears, followed by 5 consecutive bullish candles.
The total move exceeds 2%.
A Bullish PowerZone is drawn with a high and low.
If the price breaks above the high, you enter a long position with a TP 1.5 times the PZ height and an SL equal to the height below.
The system executes the trade and exits automatically at TP or SL.
Conclusion
This strategy is great for capturing strong price movements after consolidation or momentum zones. It’s automated, visual, and customizable, making it useful for both beginner and advanced traders. Try it out and adjust it to fit your trading style!

TEMA OBOS Strategy PakunTEMA OBOS Strategy
Overview
This strategy combines a trend-following approach using the Triple Exponential Moving Average (TEMA) with Overbought/Oversold (OBOS) indicator filtering.
By utilizing TEMA crossovers to determine trend direction and OBOS as a filter, it aims to improve entry precision.
This strategy can be applied to markets such as Forex, Stocks, and Crypto, and is particularly designed for mid-term timeframes (5-minute to 1-hour charts).
Strategy Objectives
Identify trend direction using TEMA
Use OBOS to filter out overbought/oversold conditions
Implement ATR-based dynamic risk management
Key Features
1. Trend Analysis Using TEMA
Uses crossover of short-term EMA (ema3) and long-term EMA (ema4) to determine entries.
ema4 acts as the primary trend filter.
2. Overbought/Oversold (OBOS) Filtering
Long Entry Condition: up > down (bullish trend confirmed)
Short Entry Condition: up < down (bearish trend confirmed)
Reduces unnecessary trades by filtering extreme market conditions.
3. ATR-Based Take Profit (TP) & Stop Loss (SL)
Adjustable ATR multiplier for TP/SL
Default settings:
TP = ATR × 5
SL = ATR × 2
Fully customizable risk parameters.
4. Customizable Parameters
TEMA Length (for trend calculation)
OBOS Length (for overbought/oversold detection)
Take Profit Multiplier
Stop Loss Multiplier
EMA Display (Enable/Disable TEMA lines)
Bar Color Change (Enable/Disable candle coloring)
Trading Rules
Long Entry (Buy Entry)
ema3 crosses above ema4 (Golden Cross)
OBOS indicator confirms up > down (bullish trend)
Execute a buy position
Short Entry (Sell Entry)
ema3 crosses below ema4 (Death Cross)
OBOS indicator confirms up < down (bearish trend)
Execute a sell position
Take Profit (TP)
Entry Price + (ATR × TP Multiplier) (Default: 5)
Stop Loss (SL)
Entry Price - (ATR × SL Multiplier) (Default: 2)
TP/SL settings are fully customizable to fine-tune risk management.
Risk Management Parameters
This strategy emphasizes proper position sizing and risk control to balance risk and return.
Trading Parameters & Considerations
Initial Account Balance: $7,000 (adjustable)
Base Currency: USD
Order Size: 10,000 USD
Pyramiding: 1
Trading Fees: $0.94 per trade
Long Position Margin: 50%
Short Position Margin: 50%
Total Trades (M5 Timeframe): 128
Deep Test Results (2024/11/01 - 2025/02/24)BTCUSD-5M
Total P&L:+1638.20USD
Max equity drawdown:694.78USD
Total trades:128
Profitable trades:44.53
Profit factor:1.45
These settings aim to protect capital while maintaining a balanced risk-reward approach.
Visual Support
TEMA Lines (Three EMAs)
Trend direction is indicated by color changes (Blue/Orange)
ema3 (short-term) and ema4 (long-term) crossover signals potential entries
OBOS Histogram
Green → Strong buying pressure
Red → Strong selling pressure
Blue → Possible trend reversal
Entry & Exit Markers
Blue Arrow → Long Entry Signal
Red Arrow → Short Entry Signal
Take Profit / Stop Loss levels displayed
Strategy Improvements & Uniqueness
This strategy is based on indicators developed by "l_lonthoff" and "jdmonto0", but has been significantly optimized for better entry accuracy, visual clarity, and risk management.
Enhanced Trend Identification with TEMA
Detects early trend reversals using ema3 & ema4 crossover
Reduces market noise for a smoother trend-following approach
Improved OBOS Filtering
Prevents excessive trading
Reduces unnecessary risk exposure
Dynamic Risk Management with ATR-Based TP/SL
Not a fixed value → TP/SL adjusts to market volatility
Fully customizable ATR multiplier settings
(Default: TP = ATR × 5, SL = ATR × 2)
Summary
The TEMA + OBOS Strategy is a simple yet powerful trading method that integrates trend analysis and oscillators.
TEMA for trend identification
OBOS for noise reduction & overbought/oversold filtering
ATR-based TP/SL settings for dynamic risk management
Before using this strategy, ensure thorough backtesting and demo trading to fine-tune parameters according to your trading style.

AO/AC Trading Zones Strategy [Skyrexio] Overview
AO/AC Trading Zones Strategy leverages the combination of Awesome Oscillator (AO), Acceleration/Deceleration Indicator (AC), Williams Fractals, Williams Alligator and Exponential Moving Average (EMA) to obtain the high probability long setups. Moreover, strategy uses multi trades system, adding funds to long position if it considered that current trend has likely became stronger. Combination of AO and AC is used for creating so-called trading zones to create the signals, while Alligator and Fractal are used in conjunction as an approximation of short-term trend to filter them. At the same time EMA (default EMA's period = 100) is used as high probability long-term trend filter to open long trades only if it considers current price action as an uptrend. More information in "Methodology" and "Justification of Methodology" paragraphs. The strategy opens only long trades.
Unique Features
No fixed stop-loss and take profit: Instead of fixed stop-loss level strategy utilizes technical condition obtained by Fractals and Alligator to identify when current uptrend is likely to be over. In some special cases strategy uses AO and AC combination to trail profit (more information in "Methodology" and "Justification of Methodology" paragraphs)
Configurable Trading Periods: Users can tailor the strategy to specific market windows, adapting to different market conditions.
Multilayer trades opening system: strategy uses only 10% of capital in every trade and open up to 5 trades at the same time if script consider current trend as strong one.
Short and long term trend trade filters: strategy uses EMA as high probability long-term trend filter and Alligator and Fractal combination as a short-term one.
Methodology
The strategy opens long trade when the following price met the conditions:
1. Price closed above EMA (by default, period = 100). Crossover is not obligatory.
2. Combination of Alligator and Williams Fractals shall consider current trend as an upward (all details in "Justification of Methodology" paragraph)
3. Both AC and AO shall print two consecutive increasing values. At the price candle close which corresponds to this condition algorithm opens the first long trade with 10% of capital.
4. If combination of Alligator and Williams Fractals shall consider current trend has been changed from up to downtrend, all long trades will be closed, no matter how many trades has been opened.
5. If AO and AC both continue printing the rising values strategy opens the long trade on each candle close with 10% of capital while number of opened trades reaches 5.
6. If AO and AC both has printed 5 rising values in a row algorithm close all trades if candle's low below the low of the 5-th candle with rising AO and AC values in a row.
Script also has additional visuals. If second long trade has been opened simultaneously the Alligator's teeth line is plotted with the green color. Also for every trade in a row from 2 to 5 the label "Buy More" is also plotted just below the teeth line. With every next simultaneously opened trade the green color of the space between teeth and price became less transparent.
Strategy settings
In the inputs window user can setup strategy setting:
EMA Length (by default = 100, period of EMA, used for long-term trend filtering EMA calculation).
User can choose the optimal parameters during backtesting on certain price chart.
Justification of Methodology
Let's explore the key concepts of this strategy and understand how they work together. We'll begin with the simplest: the EMA.
The Exponential Moving Average (EMA) is a type of moving average that assigns greater weight to recent price data, making it more responsive to current market changes compared to the Simple Moving Average (SMA). This tool is widely used in technical analysis to identify trends and generate buy or sell signals. The EMA is calculated as follows:
1.Calculate the Smoothing Multiplier:
Multiplier = 2 / (n + 1), Where n is the number of periods.
2. EMA Calculation
EMA = (Current Price) × Multiplier + (Previous EMA) × (1 − Multiplier)
In this strategy, the EMA acts as a long-term trend filter. For instance, long trades are considered only when the price closes above the EMA (default: 100-period). This increases the likelihood of entering trades aligned with the prevailing trend.
Next, let’s discuss the short-term trend filter, which combines the Williams Alligator and Williams Fractals. Williams Alligator
Developed by Bill Williams, the Alligator is a technical indicator that identifies trends and potential market reversals. It consists of three smoothed moving averages:
Jaw (Blue Line): The slowest of the three, based on a 13-period smoothed moving average shifted 8 bars ahead.
Teeth (Red Line): The medium-speed line, derived from an 8-period smoothed moving average shifted 5 bars forward.
Lips (Green Line): The fastest line, calculated using a 5-period smoothed moving average shifted 3 bars forward.
When the lines diverge and align in order, the "Alligator" is "awake," signaling a strong trend. When the lines overlap or intertwine, the "Alligator" is "asleep," indicating a range-bound or sideways market. This indicator helps traders determine when to enter or avoid trades.
Fractals, another tool by Bill Williams, help identify potential reversal points on a price chart. A fractal forms over at least five consecutive bars, with the middle bar showing either:
Up Fractal: Occurs when the middle bar has a higher high than the two preceding and two following bars, suggesting a potential downward reversal.
Down Fractal: Happens when the middle bar shows a lower low than the surrounding two bars, hinting at a possible upward reversal.
Traders often use fractals alongside other indicators to confirm trends or reversals, enhancing decision-making accuracy.
How do these tools work together in this strategy? Let’s consider an example of an uptrend.
When the price breaks above an up fractal, it signals a potential bullish trend. This occurs because the up fractal represents a shift in market behavior, where a temporary high was formed due to selling pressure. If the price revisits this level and breaks through, it suggests the market sentiment has turned bullish.
The breakout must occur above the Alligator’s teeth line to confirm the trend. A breakout below the teeth is considered invalid, and the downtrend might still persist. Conversely, in a downtrend, the same logic applies with down fractals.
In this strategy if the most recent up fractal breakout occurs above the Alligator's teeth and follows the last down fractal breakout below the teeth, the algorithm identifies an uptrend. Long trades can be opened during this phase if a signal aligns. If the price breaks a down fractal below the teeth line during an uptrend, the strategy assumes the uptrend has ended and closes all open long trades.
By combining the EMA as a long-term trend filter with the Alligator and fractals as short-term filters, this approach increases the likelihood of opening profitable trades while staying aligned with market dynamics.
Now let's talk about the trading zones concept and its signals. To understand this we need to briefly introduce what is AO and AC. The Awesome Oscillator (AO), developed by Bill Williams, is a momentum indicator designed to measure market momentum by contrasting recent price movements with a longer-term historical perspective. It helps traders detect potential trend reversals and assess the strength of ongoing trends.
The formula for AO is as follows:
AO = SMA5(Median Price) − SMA34(Median Price)
where:
Median Price = (High + Low) / 2
SMA5 = 5-period Simple Moving Average of the Median Price
SMA 34 = 34-period Simple Moving Average of the Median Price
The Acceleration/Deceleration (AC) Indicator, introduced by Bill Williams, measures the rate of change in market momentum. It highlights shifts in the driving force of price movements and helps traders spot early signs of trend changes. The AC Indicator is particularly useful for identifying whether the current momentum is accelerating or decelerating, which can indicate potential reversals or continuations. For AC calculation we shall use the AO calculated above is the following formula:
AC = AO − SMA5(AO) , where SMA5(AO)is the 5-period Simple Moving Average of the Awesome Oscillator
When the AC is above the zero line and rising, it suggests accelerating upward momentum.
When the AC is below the zero line and falling, it indicates accelerating downward momentum.
When the AC is below zero line and rising it suggests the decelerating the downtrend momentum. When AC is above the zero line and falling, it suggests the decelerating the uptrend momentum.
Now let's discuss the trading zones concept and how it can create the signal. Zones are created by the combination of AO and AC. We can divide three zone types:
Greed zone: when the AO and AC both are rising
Red zone: when the AO and AC both are decreasing
Gray zone: when one of AO or AC is rising, the other is falling
Gray zone is considered as uncertainty. AC and AO are moving in the opposite direction. Strategy skip such price action to decrease the chance to stuck in the losing trade during potential sideways. Red zone is also not interesting for the algorithm because both indicators consider the trend as bearish, but strategy opens only long trades. It is waiting for the green zone to increase the chance to open trade in the direction of the potential uptrend. When we have 2 candles in a row in the green zone script executes a long trade with 10% of capital.
Two green zone candles in a row is considered by algorithm as a bullish trend, but now so strong, that's the reason why trade is going to be closed when the combination of Alligator and Fractals will consider the the trend change from bullish to bearish. If id did not happens, algorithm starts to count the green zone candles in a row. When we have 5 in a row script change the trade closing condition. Such situation is considered is a high probability strong bull market and all trades will be closed if candle's low will be lower than fifth green zone candle's low. This is used to increase probability to secure the profit. If long trades are initiated, the strategy continues utilizing subsequent signals until the total number of trades reaches a maximum of 5. Each trade uses 10% of capital.
Why we use trading zones signals? If currently strategy algorithm considers the high probability of the short-term uptrend with the Alligator and Fractals combination pointed out above and the long-term trend is also suggested by the EMA filter as bullish. Rising AC and AO values in the direction of the most likely main trend signaling that we have the high probability of the fastest bullish phase on the market. The main idea is to take part in such rapid moves and add trades if this move continues its acceleration according to indicators.
Backtest Results
Operating window: Date range of backtests is 2023.01.01 - 2024.12.31. It is chosen to let the strategy to close all opened positions.
Commission and Slippage: Includes a standard Binance commission of 0.1% and accounts for possible slippage over 5 ticks.
Initial capital: 10000 USDT
Percent of capital used in every trade: 10%
Maximum Single Position Loss: -9.49%
Maximum Single Profit: +24.33%
Net Profit: +4374.70 USDT (+43.75%)
Total Trades: 278 (39.57% win rate)
Profit Factor: 2.203
Maximum Accumulated Loss: 668.16 USDT (-5.43%)
Average Profit per Trade: 15.74 USDT (+1.37%)
Average Trade Duration: 60 hours
How to Use
Add the script to favorites for easy access.
Apply to the desired timeframe and chart (optimal performance observed on 4h BTC/USDT).
Configure settings using the dropdown choice list in the built-in menu.
Set up alerts to automate strategy positions through web hook with the text: {{strategy.order.alert_message}}
Disclaimer:
Educational and informational tool reflecting Skyrex commitment to informed trading. Past performance does not guarantee future results. Test strategies in a simulated environment before live implementation
These results are obtained with realistic parameters representing trading conditions observed at major exchanges such as Binance and with realistic trading portfolio usage parameters.

Bullish Reversal Bar Strategy [Skyrexio]Overview
Bullish Reversal Bar Strategy leverages the combination of candlestick pattern Bullish Reversal Bar (description in Methodology and Justification of Methodology), Williams Alligator indicator and Williams Fractals to create the high probability setups. Candlestick pattern is used for the entering into trade, while the combination of Williams Alligator and Fractals is used for the trend approximation as close condition. Strategy uses only long trades.
Unique Features
No fixed stop-loss and take profit: Instead of fixed stop-loss level strategy utilizes technical condition obtained by Fractals and Alligator or the candlestick pattern invalidation to identify when current uptrend is likely to be over (more information in "Methodology" and "Justification of Methodology" paragraphs)
Configurable Trading Periods: Users can tailor the strategy to specific market windows, adapting to different market conditions.
Trend Trade Filter: strategy uses Alligator and Fractal combination as high probability trend filter.
Methodology
The strategy opens long trade when the following price met the conditions:
1.Current candle's high shall be below the Williams Alligator's lines (Jaw, Lips, Teeth)(all details in "Justification of Methodology" paragraph)
2.Price shall create the candlestick pattern "Bullish Reversal Bar". Optionally if MFI and AO filters are enabled current candle shall have the decreasing AO and at least one of three recent bars shall have the squat state on the MFI (all details in "Justification of Methodology" paragraph)
3.If price breaks through the high of the candle marked as the "Bullish Reversal Bar" the long trade is open at the price one tick above the candle's high
4.Initial stop loss is placed at the Bullish Reversal Bar's candle's low
5.If price hit the Bullish Reversal Bar's low before hitting the entry price potential trade is cancelled
6.If trade is active and initial stop loss has not been hit, trade is closed when the combination of Alligator and Williams Fractals shall consider current trend change from upward to downward.
Strategy settings
In the inputs window user can setup strategy setting:
Enable MFI (if true trades are filtered using Market Facilitation Index (MFI) condition all details in "Justification of Methodology" paragraph), by default = false)
Enable AO (if true trades are filtered using Awesome Oscillator (AO) condition all details in "Justification of Methodology" paragraph), by default = false)
Justification of Methodology
Let's explore the key concepts of this strategy and understand how they work together. The first and key concept is the Bullish Reversal Bar candlestick pattern. This is just the single bar pattern. The rules are simple:
Candle shall be closed in it's upper half
High of this candle shall be below all three Alligator's lines (Jaw, Lips, Teeth)
Next, let’s discuss the short-term trend filter, which combines the Williams Alligator and Williams Fractals. Williams Alligator
Developed by Bill Williams, the Alligator is a technical indicator that identifies trends and potential market reversals. It consists of three smoothed moving averages:
Jaw (Blue Line): The slowest of the three, based on a 13-period smoothed moving average shifted 8 bars ahead.
Teeth (Red Line): The medium-speed line, derived from an 8-period smoothed moving average shifted 5 bars forward.
Lips (Green Line): The fastest line, calculated using a 5-period smoothed moving average shifted 3 bars forward.
When the lines diverge and align in order, the "Alligator" is "awake," signaling a strong trend. When the lines overlap or intertwine, the "Alligator" is "asleep," indicating a range-bound or sideways market. This indicator helps traders determine when to enter or avoid trades.
Fractals, another tool by Bill Williams, help identify potential reversal points on a price chart. A fractal forms over at least five consecutive bars, with the middle bar showing either:
Up Fractal: Occurs when the middle bar has a higher high than the two preceding and two following bars, suggesting a potential downward reversal.
Down Fractal: Happens when the middle bar shows a lower low than the surrounding two bars, hinting at a possible upward reversal.
Traders often use fractals alongside other indicators to confirm trends or reversals, enhancing decision-making accuracy.
How do these tools work together in this strategy? Let’s consider an example of an uptrend.
When the price breaks above an up fractal, it signals a potential bullish trend. This occurs because the up fractal represents a shift in market behavior, where a temporary high was formed due to selling pressure. If the price revisits this level and breaks through, it suggests the market sentiment has turned bullish.
The breakout must occur above the Alligator’s teeth line to confirm the trend. A breakout below the teeth is considered invalid, and the downtrend might still persist. Conversely, in a downtrend, the same logic applies with down fractals.
How we can use all these indicators in this strategy? This strategy is a counter trend one. Candle's high shall be below all Alligator's lines. During this market stage the bullish reversal bar candlestick pattern shall be printed. This bar during the downtrend is a high probability setup for the potential reversal to the upside: bulls were able to close the price in the upper half of a candle. The breaking of its high is a high probability signal that trend change is confirmed and script opens long trade. If market continues going down and break down the bullish reversal bar's low potential trend change has been invalidated and strategy close long trade.
If market really reversed and started moving to the upside strategy waits for the trend change form the downtrend to the uptrend according to approximation of Alligator and Fractals combination. If this change happens strategy close the trade. This approach helps to stay in the long trade while the uptrend continuation is likely and close it if there is a high probability of the uptrend finish.
Optionally users can enable MFI and AO filters. First of all, let's briefly explain what are these two indicators. The Awesome Oscillator (AO), created by Bill Williams, is a momentum-based indicator that evaluates market momentum by comparing recent price activity to a broader historical context. It assists traders in identifying potential trend reversals and gauging trend strength.
AO = SMA5(Median Price) − SMA34(Median Price)
where:
Median Price = (High + Low) / 2
SMA5 = 5-period Simple Moving Average of the Median Price
SMA 34 = 34-period Simple Moving Average of the Median Price
This indicator is filtering signals in the following way: if current AO bar is decreasing this candle can be interpreted as a bullish reversal bar. This logic is applicable because initially this strategy is a trend reversal, it is searching for the high probability setup against the current trend. Decreasing AO is the additional high probability filter of a downtrend.
Let's briefly look what is MFI. The Market Facilitation Index (MFI) is a technical indicator that measures the price movement per unit of volume, helping traders gauge the efficiency of price movement in relation to trading volume. Here's how you can calculate it:
MFI = (High−Low)/Volume
MFI can be used in combination with volume, so we can divide 4 states. Bill Williams introduced these to help traders interpret the interaction between volume and price movement. Here’s a quick summary:
Green Window (Increased MFI & Increased Volume): Indicates strong momentum with both price and volume increasing. Often a sign of trend continuation, as both buying and selling interest are rising.
Fake Window (Increased MFI & Decreased Volume): Shows that price is moving but with lower volume, suggesting weak support for the trend. This can signal a potential end of the current trend.
Squat Window (Decreased MFI & Increased Volume): Shows high volume but little price movement, indicating a tug-of-war between buyers and sellers. This often precedes a breakout as the pressure builds.
Fade Window (Decreased MFI & Decreased Volume): Indicates a lack of interest from both buyers and sellers, leading to lower momentum. This typically happens in range-bound markets and may signal consolidation before a new move.
For our purposes we are interested in squat bars. This is the sign that volume cannot move the price easily. This type of bar increases the probability of trend reversal. In this indicator we added to enable the MFI filter of reversal bars. If potential reversal bar or two preceding bars have squat state this bar can be interpret as a reversal one.
Backtest Results
Operating window: Date range of backtests is 2023.01.01 - 2024.12.31. It is chosen to let the strategy to close all opened positions.
Commission and Slippage: Includes a standard Binance commission of 0.1% and accounts for possible slippage over 5 ticks.
Initial capital: 10000 USDT
Percent of capital used in every trade: 50%
Maximum Single Position Loss: -5.29%
Maximum Single Profit: +29.99%
Net Profit: +5472.66 USDT (+54.73%)
Total Trades: 103 (33.98% win rate)
Profit Factor: 1.634
Maximum Accumulated Loss: 1231.15 USDT (-8.32%)
Average Profit per Trade: 53.13 USDT (+0.94%)
Average Trade Duration: 76 hours
How to Use
Add the script to favorites for easy access.
Apply to the desired timeframe and chart (optimal performance observed on 4h ETH/USDT).
Configure settings using the dropdown choice list in the built-in menu.
Set up alerts to automate strategy positions through web hook with the text: {{strategy.order.alert_message}}
Disclaimer:
Educational and informational tool reflecting Skyrex commitment to informed trading. Past performance does not guarantee future results. Test strategies in a simulated environment before live implementation
These results are obtained with realistic parameters representing trading conditions observed at major exchanges such as Binance and with realistic trading portfolio usage parameters.

MultiLayer Acceleration/Deceleration Strategy [Skyrexio]Overview
MultiLayer Acceleration/Deceleration Strategy leverages the combination of Acceleration/Deceleration Indicator(AC), Williams Alligator, Williams Fractals and Exponential Moving Average (EMA) to obtain the high probability long setups. Moreover, strategy uses multi trades system, adding funds to long position if it considered that current trend has likely became stronger. Acceleration/Deceleration Indicator is used for creating signals, while Alligator and Fractal are used in conjunction as an approximation of short-term trend to filter them. At the same time EMA (default EMA's period = 100) is used as high probability long-term trend filter to open long trades only if it considers current price action as an uptrend. More information in "Methodology" and "Justification of Methodology" paragraphs. The strategy opens only long trades.
Unique Features
No fixed stop-loss and take profit: Instead of fixed stop-loss level strategy utilizes technical condition obtained by Fractals and Alligator to identify when current uptrend is likely to be over (more information in "Methodology" and "Justification of Methodology" paragraphs)
Configurable Trading Periods: Users can tailor the strategy to specific market windows, adapting to different market conditions.
Multilayer trades opening system: strategy uses only 10% of capital in every trade and open up to 5 trades at the same time if script consider current trend as strong one.
Short and long term trend trade filters: strategy uses EMA as high probability long-term trend filter and Alligator and Fractal combination as a short-term one.
Methodology
The strategy opens long trade when the following price met the conditions:
1. Price closed above EMA (by default, period = 100). Crossover is not obligatory.
2. Combination of Alligator and Williams Fractals shall consider current trend as an upward (all details in "Justification of Methodology" paragraph)
3. Acceleration/Deceleration shall create one of two types of long signals (all details in "Justification of Methodology" paragraph). Buy stop order is placed one tick above the candle's high of last created long signal.
4. If price reaches the order price, long position is opened with 10% of capital.
5. If currently we have opened position and price creates and hit the order price of another one long signal, another one long position will be added to the previous with another one 10% of capital. Strategy allows to open up to 5 long trades simultaneously.
6. If combination of Alligator and Williams Fractals shall consider current trend has been changed from up to downtrend, all long trades will be closed, no matter how many trades has been opened.
Script also has additional visuals. If second long trade has been opened simultaneously the Alligator's teeth line is plotted with the green color. Also for every trade in a row from 2 to 5 the label "Buy More" is also plotted just below the teeth line. With every next simultaneously opened trade the green color of the space between teeth and price became less transparent.
Strategy settings
In the inputs window user can setup strategy setting: EMA Length (by default = 100, period of EMA, used for long-term trend filtering EMA calculation). User can choose the optimal parameters during backtesting on certain price chart.
Justification of Methodology
Let's explore the key concepts of this strategy and understand how they work together. We'll begin with the simplest: the EMA.
The Exponential Moving Average (EMA) is a type of moving average that assigns greater weight to recent price data, making it more responsive to current market changes compared to the Simple Moving Average (SMA). This tool is widely used in technical analysis to identify trends and generate buy or sell signals. The EMA is calculated as follows:
1.Calculate the Smoothing Multiplier:
Multiplier = 2 / (n + 1), Where n is the number of periods.
2. EMA Calculation
EMA = (Current Price) × Multiplier + (Previous EMA) × (1 − Multiplier)
In this strategy, the EMA acts as a long-term trend filter. For instance, long trades are considered only when the price closes above the EMA (default: 100-period). This increases the likelihood of entering trades aligned with the prevailing trend.
Next, let’s discuss the short-term trend filter, which combines the Williams Alligator and Williams Fractals. Williams Alligator
Developed by Bill Williams, the Alligator is a technical indicator that identifies trends and potential market reversals. It consists of three smoothed moving averages:
Jaw (Blue Line): The slowest of the three, based on a 13-period smoothed moving average shifted 8 bars ahead.
Teeth (Red Line): The medium-speed line, derived from an 8-period smoothed moving average shifted 5 bars forward.
Lips (Green Line): The fastest line, calculated using a 5-period smoothed moving average shifted 3 bars forward.
When the lines diverge and align in order, the "Alligator" is "awake," signaling a strong trend. When the lines overlap or intertwine, the "Alligator" is "asleep," indicating a range-bound or sideways market. This indicator helps traders determine when to enter or avoid trades.
Fractals, another tool by Bill Williams, help identify potential reversal points on a price chart. A fractal forms over at least five consecutive bars, with the middle bar showing either:
Up Fractal: Occurs when the middle bar has a higher high than the two preceding and two following bars, suggesting a potential downward reversal.
Down Fractal: Happens when the middle bar shows a lower low than the surrounding two bars, hinting at a possible upward reversal.
Traders often use fractals alongside other indicators to confirm trends or reversals, enhancing decision-making accuracy.
How do these tools work together in this strategy? Let’s consider an example of an uptrend.
When the price breaks above an up fractal, it signals a potential bullish trend. This occurs because the up fractal represents a shift in market behavior, where a temporary high was formed due to selling pressure. If the price revisits this level and breaks through, it suggests the market sentiment has turned bullish.
The breakout must occur above the Alligator’s teeth line to confirm the trend. A breakout below the teeth is considered invalid, and the downtrend might still persist. Conversely, in a downtrend, the same logic applies with down fractals.
In this strategy if the most recent up fractal breakout occurs above the Alligator's teeth and follows the last down fractal breakout below the teeth, the algorithm identifies an uptrend. Long trades can be opened during this phase if a signal aligns. If the price breaks a down fractal below the teeth line during an uptrend, the strategy assumes the uptrend has ended and closes all open long trades.
By combining the EMA as a long-term trend filter with the Alligator and fractals as short-term filters, this approach increases the likelihood of opening profitable trades while staying aligned with market dynamics.
Now let's talk about Acceleration/Deceleration signals. AC indicator is calculated using the Awesome Oscillator, so let's first of all briefly explain what is Awesome Oscillator and how it can be calculated. The Awesome Oscillator (AO), developed by Bill Williams, is a momentum indicator designed to measure market momentum by contrasting recent price movements with a longer-term historical perspective. It helps traders detect potential trend reversals and assess the strength of ongoing trends.
The formula for AO is as follows:
AO = SMA5(Median Price) − SMA34(Median Price)
where:
Median Price = (High + Low) / 2
SMA5 = 5-period Simple Moving Average of the Median Price
SMA 34 = 34-period Simple Moving Average of the Median Price
The Acceleration/Deceleration (AC) Indicator, introduced by Bill Williams, measures the rate of change in market momentum. It highlights shifts in the driving force of price movements and helps traders spot early signs of trend changes. The AC Indicator is particularly useful for identifying whether the current momentum is accelerating or decelerating, which can indicate potential reversals or continuations. For AC calculation we shall use the AO calculated above is the following formula:
AC = AO − SMA5(AO), where SMA5(AO)is the 5-period Simple Moving Average of the Awesome Oscillator
When the AC is above the zero line and rising, it suggests accelerating upward momentum.
When the AC is below the zero line and falling, it indicates accelerating downward momentum.
When the AC is below zero line and rising it suggests the decelerating the downtrend momentum. When AC is above the zero line and falling, it suggests the decelerating the uptrend momentum.
Now we can explain which AC signal types are used in this strategy. The first type of long signal is when AC value is below zero line. In this cases we need to see three rising bars on the histogram in a row after the falling one. The second type of signals occurs above the zero line. There we need only two rising AC bars in a row after the falling one to create the signal. The signal bar is the last green bar in this sequence. The strategy places the buy stop order one tick above the candle's high, which corresponds to the signal bar on AC indicator.
After that we can have the following scenarios:
Price hit the order on the next candle in this case strategy opened long with this price.
Price doesn't hit the order price, the next candle set lower high. If current AC bar is increasing buy stop order changes by the script to the high of this new bar plus one tick. This procedure repeats until price finally hit buy order or current AC bar become decreasing. In the second case buy order cancelled and strategy wait for the next AC signal.
If long trades are initiated, the strategy continues utilizing subsequent signals until the total number of trades reaches a maximum of 5. All open trades are closed when the trend shifts to a downtrend, as determined by the combination of the Alligator and Fractals described earlier.
Why we use AC signals? If currently strategy algorithm considers the high probability of the short-term uptrend with the Alligator and Fractals combination pointed out above and the long-term trend is also suggested by the EMA filter as bullish. Rising AC bars after period of falling AC bars indicates the high probability of local pull back end and there is a high chance to open long trade in the direction of the most likely main uptrend. The numbers of rising bars are different for the different AC values (below or above zero line). This is needed because if AC below zero line the local downtrend is likely to be stronger and needs more rising bars to confirm that it has been changed than if AC is above zero.
Why strategy use only 10% per signal? Sometimes we can see the false signals which appears on sideways. Not risking that much script use only 10% per signal. If the first long trade has been open and price continue going up and our trend approximation by Alligator and Fractals is uptrend, strategy add another one 10% of capital to every next AC signal while number of active trades no more than 5. This capital allocation allows to take part in long trades when current uptrend is likely to be strong and use only 10% of capital when there is a high probability of sideways.
Backtest Results
Operating window: Date range of backtests is 2023.01.01 - 2024.11.01. It is chosen to let the strategy to close all opened positions.
Commission and Slippage: Includes a standard Binance commission of 0.1% and accounts for possible slippage over 5 ticks.
Initial capital: 10000 USDT
Percent of capital used in every trade: 10%
Maximum Single Position Loss: -5.15%
Maximum Single Profit: +24.57%
Net Profit: +2108.85 USDT (+21.09%)
Total Trades: 111 (36.94% win rate)
Profit Factor: 2.391
Maximum Accumulated Loss: 367.61 USDT (-2.97%)
Average Profit per Trade: 19.00 USDT (+1.78%)
Average Trade Duration: 75 hours
How to Use
Add the script to favorites for easy access.
Apply to the desired timeframe and chart (optimal performance observed on 3h BTC/USDT).
Configure settings using the dropdown choice list in the built-in menu.
Set up alerts to automate strategy positions through web hook with the text: {{strategy.order.alert_message}}
Disclaimer:
Educational and informational tool reflecting Skyrex commitment to informed trading. Past performance does not guarantee future results. Test strategies in a simulated environment before live implementation
These results are obtained with realistic parameters representing trading conditions observed at major exchanges such as Binance and with realistic trading portfolio usage parameters.

MultiLayer Awesome Oscillator Saucer Strategy [Skyrexio]Overview
MultiLayer Awesome Oscillator Saucer Strategy leverages the combination of Awesome Oscillator (AO), Williams Alligator, Williams Fractals and Exponential Moving Average (EMA) to obtain the high probability long setups. Moreover, strategy uses multi trades system, adding funds to long position if it considered that current trend has likely became stronger. Awesome Oscillator is used for creating signals, while Alligator and Fractal are used in conjunction as an approximation of short-term trend to filter them. At the same time EMA (default EMA's period = 100) is used as high probability long-term trend filter to open long trades only if it considers current price action as an uptrend. More information in "Methodology" and "Justification of Methodology" paragraphs. The strategy opens only long trades.
Unique Features
No fixed stop-loss and take profit: Instead of fixed stop-loss level strategy utilizes technical condition obtained by Fractals and Alligator to identify when current uptrend is likely to be over (more information in "Methodology" and "Justification of Methodology" paragraphs)
Configurable Trading Periods: Users can tailor the strategy to specific market windows, adapting to different market conditions.
Multilayer trades opening system: strategy uses only 10% of capital in every trade and open up to 5 trades at the same time if script consider current trend as strong one.
Short and long term trend trade filters: strategy uses EMA as high probability long-term trend filter and Alligator and Fractal combination as a short-term one.
Methodology
The strategy opens long trade when the following price met the conditions:
1. Price closed above EMA (by default, period = 100). Crossover is not obligatory.
2. Combination of Alligator and Williams Fractals shall consider current trend as an upward (all details in "Justification of Methodology" paragraph)
3. Awesome Oscillator shall create the "Saucer" long signal (all details in "Justification of Methodology" paragraph). Buy stop order is placed one tick above the candle's high of last created "Saucer signal".
4. If price reaches the order price, long position is opened with 10% of capital.
5. If currently we have opened position and price creates and hit the order price of another one "Saucer" signal another one long position will be added to the previous with another one 10% of capital. Strategy allows to open up to 5 long trades simultaneously.
6. If combination of Alligator and Williams Fractals shall consider current trend has been changed from up to downtrend, all long trades will be closed, no matter how many trades has been opened.
Script also has additional visuals. If second long trade has been opened simultaneously the Alligator's teeth line is plotted with the green color. Also for every trade in a row from 2 to 5 the label "Buy More" is also plotted just below the teeth line. With every next simultaneously opened trade the green color of the space between teeth and price became less transparent.
Strategy settings
In the inputs window user can setup strategy setting: EMA Length (by default = 100, period of EMA, used for long-term trend filtering EMA calculation). User can choose the optimal parameters during backtesting on certain price chart.
Justification of Methodology
Let's go through all concepts used in this strategy to understand how they works together. Let's start from the easies one, the EMA. Let's briefly explain what is EMA. The Exponential Moving Average (EMA) is a type of moving average that gives more weight to recent prices, making it more responsive to current price changes compared to the Simple Moving Average (SMA). It is commonly used in technical analysis to identify trends and generate buy or sell signals. It can be calculated with the following steps:
1.Calculate the Smoothing Multiplier:
Multiplier = 2 / (n + 1), Where n is the number of periods.
2. EMA Calculation
EMA = (Current Price) × Multiplier + (Previous EMA) × (1 − Multiplier)
In this strategy uses EMA an initial long term trend filter. It allows to open long trades only if price close above EMA (by default 50 period). It increases the probability of taking long trades only in the direction of the trend.
Let's go to the next, short-term trend filter which consists of Alligator and Fractals. Let's briefly explain what do these indicators means. The Williams Alligator, developed by Bill Williams, is a technical indicator designed to spot trends and potential market reversals. It uses three smoothed moving averages, referred to as the jaw, teeth, and lips:
Jaw (Blue Line): The slowest of the three, based on a 13-period smoothed moving average shifted 8 bars ahead.
Teeth (Red Line): The medium-speed line, derived from an 8-period smoothed moving average shifted 5 bars forward.
Lips (Green Line): The fastest line, calculated using a 5-period smoothed moving average shifted 3 bars forward.
When these lines diverge and are properly aligned, the "alligator" is considered "awake," signaling a strong trend. Conversely, when the lines overlap or intertwine, the "alligator" is "asleep," indicating a range-bound or sideways market. This indicator assists traders in identifying when to act on or avoid trades.
The Williams Fractals, another tool introduced by Bill Williams, are used to pinpoint potential reversal points on a price chart. A fractal forms when there are at least five consecutive bars, with the middle bar displaying the highest high (for an up fractal) or the lowest low (for a down fractal), relative to the two bars on either side.
Key Points:
Up Fractal: Occurs when the middle bar has a higher high than the two preceding and two following bars, suggesting a potential downward reversal.
Down Fractal: Happens when the middle bar shows a lower low than the surrounding two bars, hinting at a possible upward reversal.
Traders often combine fractals with other indicators to confirm trends or reversals, improving the accuracy of trading decisions.
How we use their combination in this strategy? Let’s consider an uptrend example. A breakout above an up fractal can be interpreted as a bullish signal, indicating a high likelihood that an uptrend is beginning. Here's the reasoning: an up fractal represents a potential shift in market behavior. When the fractal forms, it reflects a pullback caused by traders selling, creating a temporary high. However, if the price manages to return to that fractal’s high and break through it, it suggests the market has "changed its mind" and a bullish trend is likely emerging.
The moment of the breakout marks the potential transition to an uptrend. It’s crucial to note that this breakout must occur above the Alligator's teeth line. If it happens below, the breakout isn’t valid, and the downtrend may still persist. The same logic applies inversely for down fractals in a downtrend scenario.
So, if last up fractal breakout was higher, than Alligator's teeth and it happened after last down fractal breakdown below teeth, algorithm considered current trend as an uptrend. During this uptrend long trades can be opened if signal was flashed. If during the uptrend price breaks down the down fractal below teeth line, strategy considered that uptrend is finished with the high probability and strategy closes all current long trades. This combination is used as a short term trend filter increasing the probability of opening profitable long trades in addition to EMA filter, described above.
Now let's talk about Awesome Oscillator's "Sauser" signals. Briefly explain what is the Awesome Oscillator. The Awesome Oscillator (AO), created by Bill Williams, is a momentum-based indicator that evaluates market momentum by comparing recent price activity to a broader historical context. It assists traders in identifying potential trend reversals and gauging trend strength.
AO = SMA5(Median Price) − SMA34(Median Price)
where:
Median Price = (High + Low) / 2
SMA5 = 5-period Simple Moving Average of the Median Price
SMA 34 = 34-period Simple Moving Average of the Median Price
Now we know what is AO, but what is the "Saucer" signal? This concept was introduced by Bill Williams, let's briefly explain it and how it's used by this strategy. Initially, this type of signal is a combination of the following AO bars: we need 3 bars in a row, the first one shall be higher than the second, the third bar also shall be higher, than second. All three bars shall be above the zero line of AO. The price bar, which corresponds to third "saucer's" bar is our signal bar. Strategy places buy stop order one tick above the price bar which corresponds to signal bar.
After that we can have the following scenarios.
Price hit the order on the next candle in this case strategy opened long with this price.
Price doesn't hit the order price, the next candle set lower low. If current AO bar is increasing buy stop order changes by the script to the high of this new bar plus one tick. This procedure repeats until price finally hit buy order or current AO bar become decreasing. In the second case buy order cancelled and strategy wait for the next "Saucer" signal.
If long trades has been opened strategy use all the next signals until number of trades doesn't exceed 5. All trades are closed when the trend changes to downtrend according to combination of Alligator and Fractals described above.
Why we use "Saucer" signals? If AO above the zero line there is a high probability that price now is in uptrend if we take into account our two trend filters. When we see the decreasing bars on AO and it's above zero it's likely can be considered as a pullback on the uptrend. When we see the stop of AO decreasing and the first increasing bar has been printed there is a high probability that this local pull back is finished and strategy open long trade in the likely direction of a main trend.
Why strategy use only 10% per signal? Sometimes we can see the false signals which appears on sideways. Not risking that much script use only 10% per signal. If the first long trade has been open and price continue going up and our trend approximation by Alligator and Fractals is uptrend, strategy add another one 10% of capital to every next saucer signal while number of active trades no more than 5. This capital allocation allows to take part in long trades when current uptrend is likely to be strong and use only 10% of capital when there is a high probability of sideways.
Backtest Results
Operating window: Date range of backtests is 2023.01.01 - 2024.11.25. It is chosen to let the strategy to close all opened positions.
Commission and Slippage: Includes a standard Binance commission of 0.1% and accounts for possible slippage over 5 ticks.
Initial capital: 10000 USDT
Percent of capital used in every trade: 10%
Maximum Single Position Loss: -5.10%
Maximum Single Profit: +22.80%
Net Profit: +2838.58 USDT (+28.39%)
Total Trades: 107 (42.99% win rate)
Profit Factor: 3.364
Maximum Accumulated Loss: 373.43 USDT (-2.98%)
Average Profit per Trade: 26.53 USDT (+2.40%)
Average Trade Duration: 78 hours
These results are obtained with realistic parameters representing trading conditions observed at major exchanges such as Binance and with realistic trading portfolio usage parameters.
How to Use
Add the script to favorites for easy access.
Apply to the desired timeframe and chart (optimal performance observed on 3h BTC/USDT).
Configure settings using the dropdown choice list in the built-in menu.
Set up alerts to automate strategy positions through web hook with the text: {{strategy.order.alert_message}}
Disclaimer:
Educational and informational tool reflecting Skyrex commitment to informed trading. Past performance does not guarantee future results. Test strategies in a simulated environment before live implementation

XAUUSD 10-Minute StrategyThis XAUUSD 10-Minute Strategy is designed for trading Gold vs. USD on a 10-minute timeframe. By combining multiple technical indicators (MACD, RSI, Bollinger Bands, and ATR), the strategy effectively captures both trend-following and reversal opportunities, with adaptive risk management for varying market volatility. This approach balances high-probability entries with robust volatility management, making it suitable for traders seeking to optimise entries during significant price movements and reversals.
Key Components and Logic:
MACD (12, 26, 9):
Generates buy signals on MACD Line crossovers above the Signal Line and sell signals on crossovers below the Signal Line, helping to capture momentum shifts.
RSI (14):
Utilizes oversold (below 35) and overbought (above 65) levels as a secondary filter to validate entries and avoid overextended price zones.
Bollinger Bands (20, 2):
Uses upper and lower Bollinger Bands to identify potential overbought and oversold conditions, aiming to enter long trades near the lower band and short trades near the upper band.
ATR-Based Stop Loss and Take Profit:
Stop Loss and Take Profit levels are dynamically set as multiples of ATR (3x for stop loss, 5x for take profit), ensuring flexibility with market volatility to optimise exit points.
Entry & Exit Conditions:
Buy Entry: T riggered when any of the following conditions are met:
MACD Line crosses above the Signal Line
RSI is oversold
Price drops below the lower Bollinger Band
Sell Entry: Triggered when any of the following conditions are met:
MACD Line crosses below the Signal Line
RSI is overbought
Price moves above the upper Bollinger Band
Exit Strategy: Trades are closed based on opposing entry signals, with adaptive spread adjustments for realistic exit points.
Backtesting Configuration & Results:
Backtesting Period: July 21, 2024, to October 30, 2024
Symbol Info: XAUUSD, 10-minute timeframe, OANDA data source
Backtesting Capital: Initial capital of $700, with each trade set to 10 contracts (equivalent to approximately 0.1 lots based on the broker’s contract size for gold).
Users should confirm their broker's contract size for gold, as this may differ. This script uses 10 contracts for backtesting purposes, aligned with 0.1 lots on brokers offering a 100-contract specification.
Key Backtesting Performance Metrics:
Net Profit: $4,733.90 USD (676.27% increase)
Total Closed Trades: 526
Win Rate: 53.99%
Profit Factor: 1.44 (1.96 for Long trades, 1.14 for Short trades)
Max Drawdown: $819.75 USD (56.33% of equity)
Sharpe Ratio: 1.726
Average Trade: $9.00 USD (0.04% of equity per trade)
This backtest reflects realistic conditions, with a spread adjustment of 38 points and no slippage or commission applied. The settings aim to simulate typical retail trading conditions. However, please adjust the initial capital, contract size, and other settings based on your account specifics for best results.
Usage:
This strategy is tuned specifically for XAUUSD on a 10-minute timeframe, ideal for both trend-following and reversal trades. The ATR-based stop loss and take profit levels adapt dynamically to market volatility, optimising entries and exits in varied conditions. To backtest this script accurately, ensure your broker’s contract specifications for gold align with the parameters used in this strategy.

Fractal Breakout Trend Following StrategyOverview
The Fractal Breakout Trend Following Strategy is a trend-following system which utilizes the Willams Fractals and Alligator to execute the long trades on the fractal's breakouts which have a high probability to be the new uptrend phase beginning. This system also uses the normalized Average True Range indicator to filter trades after a large moves, because it's more likely to see the trend continuation after a consolidation period. Strategy can execute only long trades.
Unique Features
Trend and volatility filtering system: Strategy uses Williams Alligator to filter the counter-trend fractals breakouts and normalized Average True Range to avoid the trades after large moves, when volatility is high
Configurable Trading Periods: Users can tailor the strategy to specific market windows, adapting to different market conditions.
Flexible Risk Management: Users can choose the stop-loss percent (by default = 3%) for trades, but strategy also has the dynamic stop-loss level using down fractals.
Methodology
The strategy places stop order at the last valid fractal breakout level. Validity of this fractal is defined by the Williams Alligator indicator. If at the moment of time when price breaking the last fractal price is higher than Alligator's teeth line (8 period SMA shifted 5 bars in the future) this is a valid breakout. Moreover strategy has the additional volatility filtering system using normalized ATR. It calculates the average normalized ATR for last user-defined number of bars and if this value lower than the user-defined threshold value the long trade is executed.
When trade is opened, script places the stop loss at the price higher of two levels: user defined stop-loss from the position entry price or down fractal validation level. The down fractal is valid with the rule, opposite as the up fractal validation. Price shall break to the downside the last down fractal below the Willians Alligator's teeth line.
Strategy has no fixed take profit. Exit level changes with the down fractal validation level. If price is in strong uptrend trade is going to be active until last down fractal is not valid. Strategy closes trade when price hits the down fractal validation level.
Risk Management
The strategy employs a combined approach to risk management:
It allows positions to ride the trend as long as the price continues to move favorably, aiming to capture significant price movements. It features a user-defined stop-loss parameter to mitigate risks based on individual risk tolerance. By default, this stop-loss is set to a 3% drop from the entry point, but it can be adjusted according to the trader's preferences.
Justification of Methodology
This strategy leverages Williams Fractals to open long trade when price has broken the key resistance level to the upside. This resistance level is the last up fractal and is shall be broken above the Williams Alligator's teeth line to be qualified as the valid breakout according to this strategy. The Alligator filtering increases the probability to avoid the false breakouts against the current trend.
Moreover strategy has an additional filter using Average True Range(ATR) indicator. If average value of ATR for the last user-defined number of bars is lower than user-defined threshold strategy can open the long trade according to open trade condition above. The logic here is following: we want to open trades after period of price consolidation inside the range because before and after a big move price is more likely to be in sideways, but we need a trend move to have a profit.
Another one important feature is how the exit condition is defined. On the one hand, strategy has the user-defined stop-loss (3% below the entry price by default). It's made to give users the opportunity to restrict their losses according to their risk-tolerance. On the other hand, strategy utilizes the dynamic exit level which is defined by down fractal activation. If we assume the breaking up fractal is the beginning of the uptrend, breaking down fractal can be the start of downtrend phase. We don't want to be in long trade if there is a high probability of reversal to the downside. This approach helps to not keep open trade if trend is not developing and hold it if price continues going up.
Backtest Results
Operating window: Date range of backtests is 2023.01.01 - 2024.05.01. It is chosen to let the strategy to close all opened positions.
Commission and Slippage: Includes a standard Binance commission of 0.1% and accounts for possible slippage over 5 ticks.
Initial capital: 10000 USDT
Percent of capital used in every trade: 30%
Maximum Single Position Loss: -3.19%
Maximum Single Profit: +24.97%
Net Profit: +3036.90 USDT (+30.37%)
Total Trades: 83 (28.92% win rate)
Profit Factor: 1.953
Maximum Accumulated Loss: 963.98 USDT (-8.29%)
Average Profit per Trade: 36.59 USDT (+1.12%)
Average Trade Duration: 72 hours
These results are obtained with realistic parameters representing trading conditions observed at major exchanges such as Binance and with realistic trading portfolio usage parameters.
How to Use
Add the script to favorites for easy access.
Apply to the desired timeframe and chart (optimal performance observed on 4h and higher time frames and the BTC/USDT).
Configure settings using the dropdown choice list in the built-in menu.
Set up alerts to automate strategy positions through web hook with the text: {{strategy.order.alert_message}}
Disclaimer:
Educational and informational tool reflecting Skyrex commitment to informed trading. Past performance does not guarantee future results. Test strategies in a simulated environment before live implementation

Momentum Alligator 4h Bitcoin StrategyOverview
The Momentum Alligator 4h Bitcoin Strategy is a trend-following trading system that operates on dual time frames. It utilizes the 1D Williams Alligator indicator to identify the prevailing major price trend and seeks trading opportunities on the 4-hour (4h) time frame when the momentum is turning up. The strategy is designed to close trades if the trend fails to develop or holding position if price continues increasing without any significant correction. Note that this strategy is specifically tailored for the 4-hour time frame.
Unique Features
2-layers market noise filtering system: Trades are only initiated in the direction of the 1D trend, determined by the Williams Alligator indicator. This higher time frame confirmation filters out minor trade signals, focusing on more substantial opportunities. At the same time, strategy has additional filter on 4h time frame with Awesome Oscillator which is showing the current price momentum.
Flexible Risk Management: The strategy exclusively opens long positions, resulting in fewer trades during bear markets. It incorporates a dynamic stop-loss mechanism, which can either follow the jaw line of the 4h Alligator or a user-defined fixed stop-loss. This flexibility helps manage risk and avoid non-trending markets.
Methodology
The strategy initiates a long position when the d-line of Stochastic RSI crosses up it's k-line. It means that there is a high probability that price momentum reversed from down to up. To avoid overtrading in potentially choppy markets, it skips the next two trades following a winning trade, anticipating sideways movement after a significant price surge.
This strategy has two layers trades filtering system: 4h and 1D time frames. The first one is awesome oscillator. It shall be increasing and value has to be higher than it's 5-period SMA. This is an additional confirmation that long trade is opened in the direction of the current momentum. As it was mentioned above, all entry signals are validated against the 1D Williams Alligator indicator. A trade is only opened if the price is above all three lines of the 1D Alligator, ensuring alignment with the major trend.
A trade is closed if the price hits the 4h jaw line of the Alligator or reaches the user-defined stop-loss level.
Risk Management
The strategy employs a combined approach to risk management:
It allows positions to ride the trend as long as the price continues to move favorably, aiming to capture significant price movements. It features a user-defined stop-loss parameter to mitigate risks based on individual risk tolerance. By default, this stop-loss is set to a 2% drop from the entry point, but it can be adjusted according to the trader's preferences.
Justification of Methodology
This strategy leverages Stochastic RSI on 4h time frame to open long trade when momentum started reversing to the upside. On the one hand, Stochastic RSI is one of the most sensitive indicator, which allows to react fast on the potential trend reversal. On the other hand, this indicator can be too sensitive and provide a lot of false trend changing signals. To eliminate this weakness we use two-layers trades filtering system.
The first layer is the 4h Awesome oscillator. This is less sensitive momentum indicator. Usually it starts increasing when price has already passed significant distance from the actual reversal point. The strategy opens long trade only is Awesome oscillator is increasing and above it's 5-period SMA. This approach increases the probability to filter the false signals during the choppy market or if the reversal is false.
The second layer filter is the Williams Alligator indicator on 1D time frame. The 1D Alligator serves as a filter for identifying the primary trend and increases probability to avoid the trades with low potential because trading against major trend usually is more risky. It's much better to catch the trend continuation than local bounce.
Last but not least feature of this strategy is close trades condition. It uses the flexible approach. First of all, user can set up the fixed stop-loss according to his own risk-tolerance, by default this value is 2% of price movement. It restricts the potential loss at the moment when trade has just been opened. Moreover strategy utilizes the 4h Williams Alligator's jaw line to exit the trade. If price fell below it trade is closed. This approach helps to not keep open trade if trend is not developing and hold it if price continues going up.
Backtest Results:
Operating window: Date range of backtests is 2021.01.01 - 2024.05.01. It is chosen to let the strategy to close all opened positions.
Commission and Slippage: Includes a standard Binance commission of 0.1% and accounts for possible slippage over 5 ticks.
Initial capital: 10000 USDT
Percent of capital used in every trade: 50%
Maximum Single Position Loss: -3.04%
Maximum Single Profit: +29.67%
Net Profit: +6228.01 USDT (+62.28%)
Total Trades: 118 (24.58% win rate)
Profit Factor: 1.71
Maximum Accumulated Loss: 1527.69 USDT (-11.52%)
Average Profit per Trade: 52.78 USDT (+0.89%)
Average Trade Duration: 60 hours
These results are obtained with realistic parameters representing trading conditions observed at major exchanges such as Binance and with realistic trading portfolio usage parameters.
How to Use:
Add the script to favorites for easy access.
Apply to the 4h timeframe desired chart (optimal performance observed on the BTC/USDT).
Configure settings using the dropdown choice list in the built-in menu.
Set up alerts to automate strategy positions through web hook with the text: {{strategy.order.alert_message}}
Disclaimer:
Educational and informational tool reflecting Skyrex commitment to informed trading. Past performance does not guarantee future results. Test strategies in a simulated environment before live implementation
